Argument Induction Connection Diagram – Ideal for Product/Service Introduction
RL0100038_2
- Last Update 01/20/2025
- File Size 1.6MB
- # of Slides 2
- File Format PPTX
- Slide Ratio 4:3
- Color
Keywords
About the Product
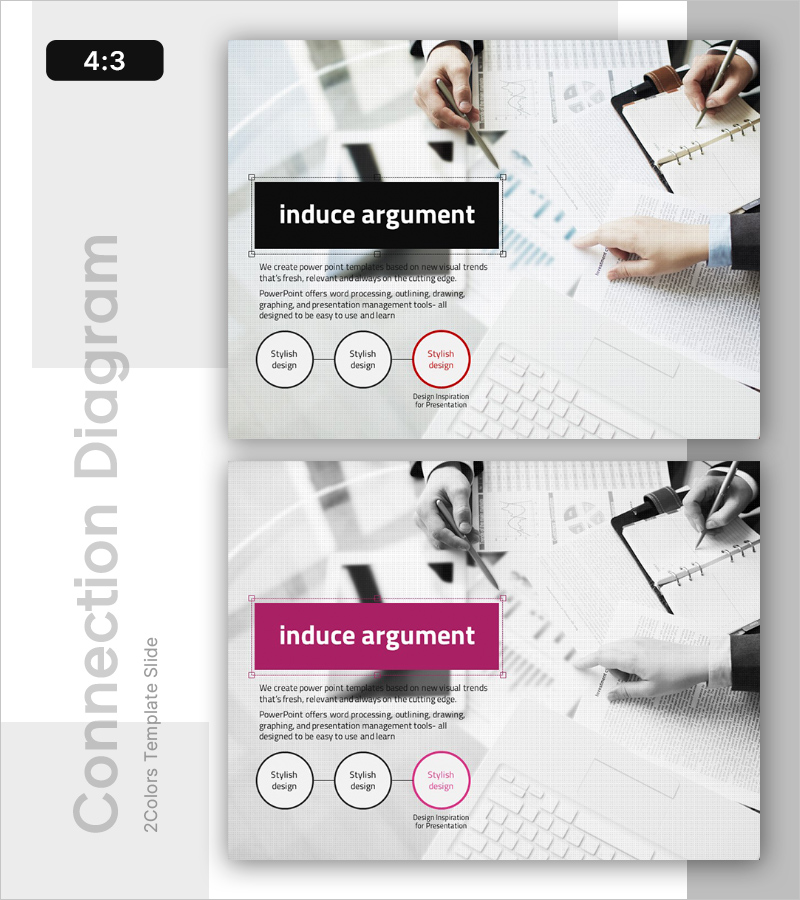
A 2-slide PowerPoint presentation designed for product and service introduction speeches, featuring a logical argument progression through a three-cluster diagram. The design combines a black title box with magenta accent elements for visual contrast, while circular cluster shapes express the connection structure. The balanced layout integrates a background image (business scene) at the top with text explanation areas below, allowing both descriptive paragraphs and diagrams to coexist. These PowerPoint slides are immediately editable, with full flexibility for color changes, text modifications, and element additions across various product introduction scenarios.
Usage Points
-
Main Usage
Structures core value propositions into three logical argument stages for product and service introduction presentations, enhancing audience comprehension and persuasiveness. The black title box and magenta accents establish clear visual hierarchy, while circular cluster diagrams intuitively represent logical connections and relationships.
-
How to Use
Enter your presentation topic in the title box, then add key argument points in each of the three circular areas. Include detailed explanations in the upper text section and replace the background image with product-related photography as needed. Color customization allows alignment with your brand identity.
-
Recommended For
Ideal for product marketing and sales team presentations, startup investment pitch decks (product section), B2B service proposal presentations, new product launch events, and corporate business development meetings. Particularly effective when logical structure and persuasive argument flow are essential.
-
Slide Structure
Two-slide format with each slide containing a background image (business scene photograph) at the top, a black title box in the center, text explanation areas at the bottom, and three circular cluster diagrams with magenta accents. Compatible with all projector environments in 4:3 aspect ratio, with each element independently editable and movable.


