Target Market Goal Setting and Analysis – Visual Data Cluster
RJ0700009_27
- Last Update 07/24/2025
- File Size 1.6MB
- # of Slides 2
- File Format PPTX
- Slide Ratio 16:9
- Color
Keywords
- #Content-Based Slides
- #Design-Based Slides
- #Market and Competitor Analysis
- #Diagram
- #Other
- #Target Market
- #Cluster
- #Combination Diagram
- #16:9
- #overlapping cluster diagram PowerPoint
- #target market analysis slides
- #geographic data visualization
- #circular node diagram
- #market distribution map template
About the Product
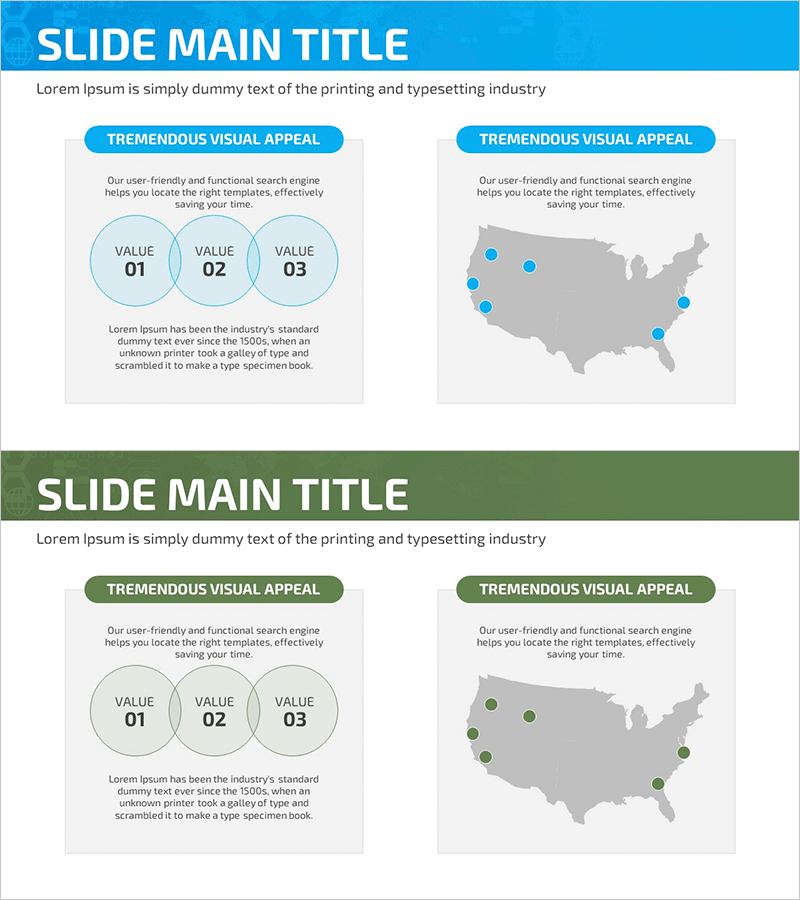
A PowerPoint slide set featuring overlapping cluster diagrams designed for target market analysis and regional data visualization. The left slide displays three intersecting circular nodes representing VALUE 01, 02, and 03, while the right slide overlays blue data points on a US map to show geographic market distribution. The light gray background combined with blue accent colors conveys data credibility and professional presentation standards. This 2-slide deck in 16:9 widescreen format is ready for immediate use in business presentations. Both the cluster nodes and map points are editable text areas, allowing you to input actual market data and customize regional targets.
Usage Points
-
Main Usage
This slide set visualizes target market distribution across regions and market segmentation data. The overlapping circular nodes represent relationships and intersections between market segments, while the geographic map visualization intuitively conveys location-based target market distribution to your audience.
-
How to Use
Enter market segment names (e.g., urban market, regional market, online market) into the VALUE 01, 02, 03 text areas on the left slide. Adjust the map point locations and quantity on the right slide to match your actual target regions. Use this slide in the market analysis section of your presentation to explain geographic customer distribution.
-
Recommended For
Recommended for marketing managers, strategy planners, and business development professionals preparing marketing plans, business proposals, and investor pitch decks. Particularly effective when explaining regional market entry strategies or customer segmentation analysis.
-
Slide Structure
2-slide composition: Slide 1 features 3 overlapping circular nodes representing market segments, each with independent text input areas. Slide 2 displays 6–8 blue data points overlaid on a US map background to indicate geographic target market locations. 16:9 widescreen format, PPTX file type.
Related Products
-

Local Signs and Academic Messages – Effective Information Delivery
#Market and Competitor Analysis #Diagram #Other
-

Analysis of the US Startup Market – Strategic Goals and Complex Insights
#Market and Competitor Analysis #Marketing Plan and Strategy #Diagram
-

Slide Visualizing America with Contemporary Colors
#Market and Competitor Analysis #Marketing Plan and Strategy #Graph
-

Asia Target Market Analysis Graph – Visualizing Market Strategy
#Market and Competitor Analysis #Marketing Plan and Strategy #Graph
