Analysis of the US Startup Market – Strategic Goals and Complex Insights
RJ0300086_36
- Last Update 05/13/2025
- File Size 0.9MB
- # of Slides 2
- File Format PPTX
- Slide Ratio 16:9
- Color
Keywords
- #Content-Based Slides
- #Design-Based Slides
- #Market and Competitor Analysis
- #Marketing Plan and Strategy
- #Diagram
- #Other
- #Target Market
- #Target Market Strategy
- #Cluster
- #Combination Diagram
- #16:9
- #Venn diagram PowerPoint slide
- #3-circle overlapping diagram
- #market analysis template
- #strategic analysis PowerPoint
- #how to create Venn diagram in PowerPoint
About the Product
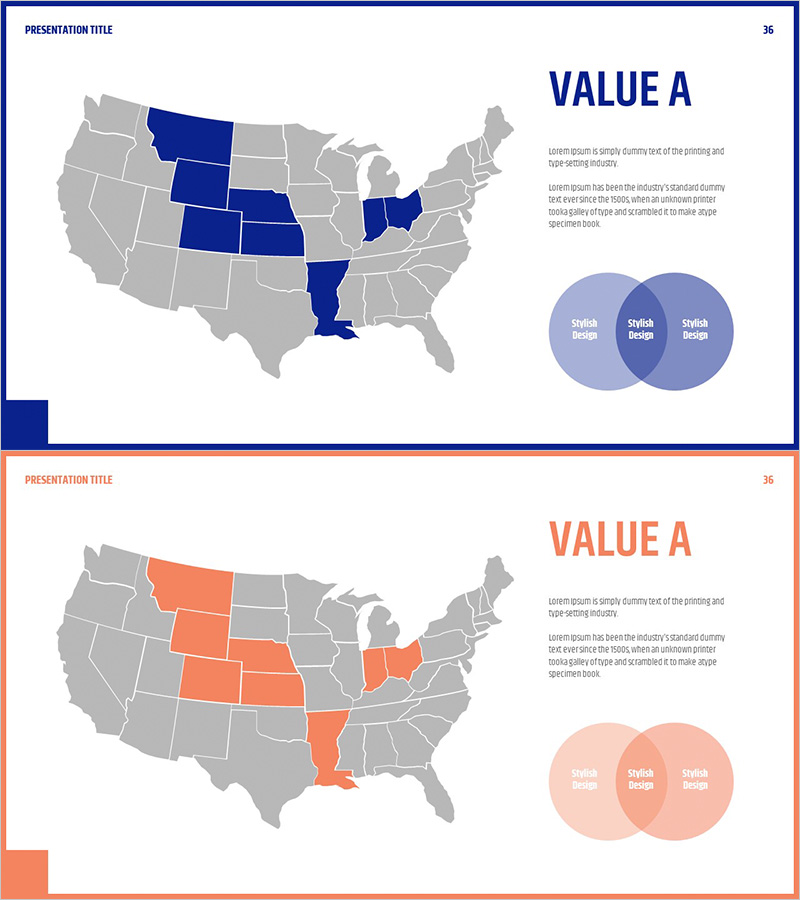
A 3-circle overlapping Venn diagram PowerPoint slide designed for US startup market analysis and strategic positioning. The three circles intersect to create distinct regions for mapping strategic goals, market insights, and competitive analysis. Two slide layouts are provided: one in navy and light blue tones, and another in orange and light peach tones, allowing you to select the color scheme that matches your presentation branding. Delivered in 16:9 widescreen PPTX format with fully editable elements, this template is optimized for data-driven presentations including market research, business strategy reports, executive briefings, and competitive landscape analysis.
Usage Points
-
Main Usage
Visualizes complex relationships and intersections across three data dimensions using overlapping circles. Ideal for startup market analysis, strategic objective mapping, and competitive positioning, where each circle represents a key factor and the intersection areas highlight integrated insights and strategic opportunities.
-
How to Use
Enter analysis categories (market opportunities, strategic goals, competitive advantages) into each circle region, and place integrated insights in the overlapping areas. Choose between navy or orange color schemes to align with your presentation branding, and adjust text sizing and placement to emphasize information hierarchy and key findings.
-
Recommended For
Recommended for marketing professionals, strategy teams, executives, and investors presenting startup market analysis. Effective for market research reports, business strategy planning sessions, investor pitch decks, competitive analysis presentations, and executive briefings where complex multi-factor relationships need clear visual explanation.
-
Slide Structure
Two-slide set featuring identical 3-circle Venn diagram layouts with distinct color palettes. Slide 1 uses navy and light blue tones; Slide 2 uses orange and light peach tones. Each circle and intersection area includes designated text input zones for flexible content placement and data visualization.
Related Products
-

Target Market Data Analysis – Visual Resource for Market Understanding
#Market and Competitor Analysis #Marketing Plan and Strategy #Other
-

South America Target Region Achievement Rate – Market and Strategy Analysis
#Market and Competitor Analysis #Marketing Plan and Strategy #Graph
-

Map Slide Visualizing Target Countries in Europe – Market Analysis
#Market and Competitor Analysis #Marketing Plan and Strategy #Other
-

Setting Target Country Goals – Market Analysis and Strategy
#Market and Competitor Analysis #Marketing Plan and Strategy #Diagram
