European Target Market Share Graph – The Power of Market Analysis
RJ0700006_24
- Last Update 07/23/2025
- File Size 2.3MB
- # of Slides 2
- File Format PPTX
- Slide Ratio 16:9
- Color
Keywords
About the Product
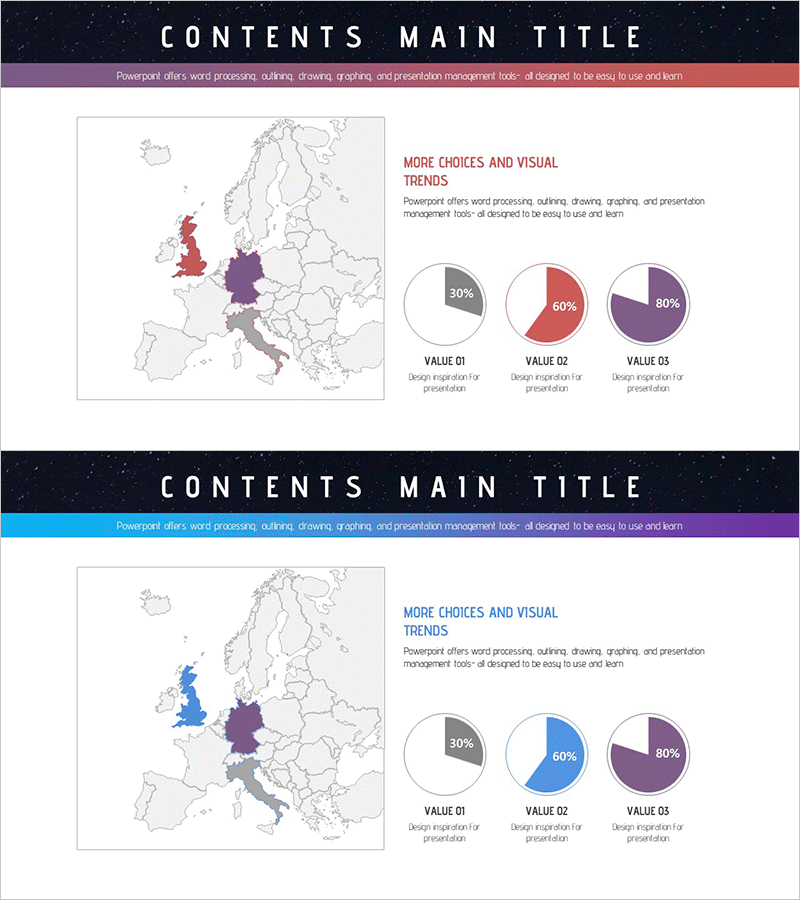
A PowerPoint slide visualizing European regional market share through three pie charts with distinct color schemes. The design combines a geographic map highlighting key countries (UK, Germany, Italy) with corresponding pie charts displaying 30%, 60%, and 80% proportions. Red, blue, and purple accent colors create clear data differentiation for market analysis presentations. The 2-slide set offers multiple color variations to match corporate branding, enabling immediate use in business reports and investor pitches.
Usage Points
-
Main Usage
Visualize European regional market share, sales distribution, and customer segments using pie charts to clearly communicate regional differences in market analysis presentations. The integrated map and graph layout simultaneously conveys geographic context and quantitative data.
-
How to Use
Use in market analysis reports, business presentations, investor briefings, and marketing strategy meetings to compare European regional performance. Customize pie chart percentages with actual data, edit country labels and legends, and adapt the layout for tailored business presentations.
-
Recommended For
Market researchers, business analysts, sales managers, executive report coordinators, and international business professionals presenting European market conditions. Particularly valuable for multinational corporations analyzing regional performance and market penetration.
-
Slide Structure
2-slide set with identical layout and different color combinations. Each slide features a European map on the left (highlighting UK, Germany, Italy) with 3 pie charts on the right (30%, 60%, 80% proportions), plus title area and legend text fields.
Related Products
-

Market Share Analysis of European Countries – Insights for Market Analysis
#Market and Competitor Analysis #Graph #Other
-

User Analysis on Coffee and Smoking – Market Trends and Insights
#Market and Competitor Analysis #Graph #Other
-

Camera Pie Chart – Market Share Analysis
#Market and Competitor Analysis #Graph #Other
-

Asia Map Presentation Template - Market Share Analysis
#Market and Competitor Analysis #Graph #Other
