Aerospace Industry Vertical Bar Graph
RJ0700006_12
- Last Update 07/23/2025
- File Size 1.8MB
- # of Slides 2
- File Format PPTX
- Slide Ratio 16:9
- Color
Keywords
About the Product
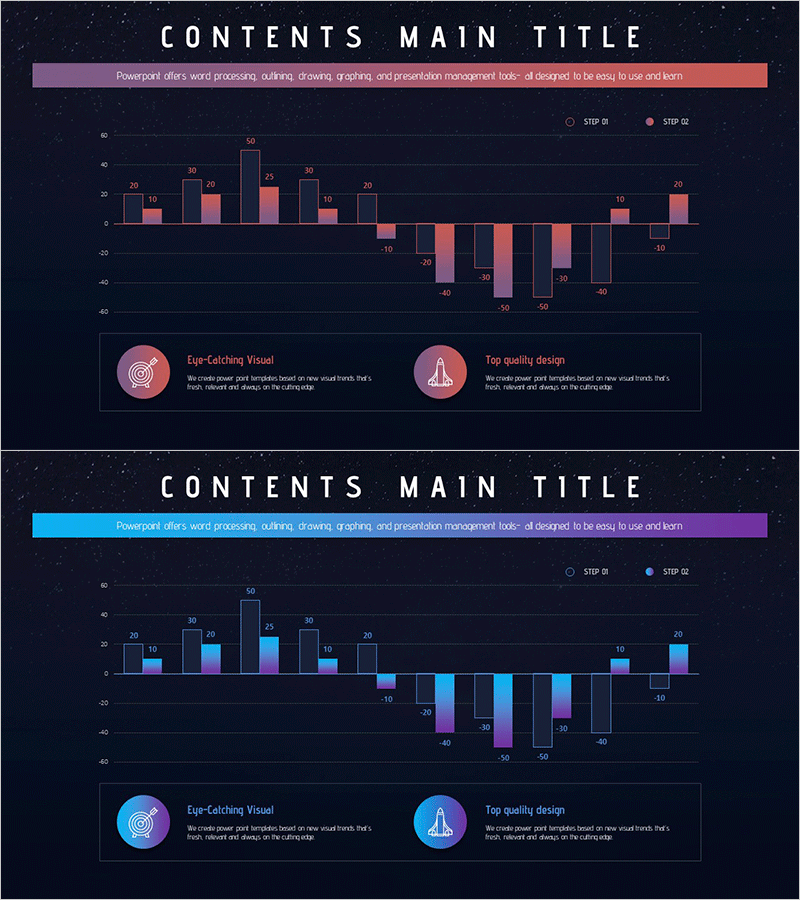
A vertical bar chart PowerPoint slide designed for aerospace industry market analysis and competitive benchmarking. The dual-series layout enables intuitive numerical comparison, with pink and coral bars set against a dark background for strong visual contrast. Each bar is labeled with precise values at the top, and the lower section features two key design highlights—'Eye-Catching Visual' and 'Top Quality Design'—accompanied by icons and descriptive text. The 2-slide set offers multiple color variations (pink, coral, blue, purple) so you can match your presentation's overall tone and branding.
Usage Points
-
Main Usage
Visualize aerospace industry metrics—market size, revenue, growth rates—across two comparable data series. Ideal for competitive benchmarking, year-over-year trends, and segment-by-segment revenue breakdowns in quantitative business presentations.
-
How to Use
Insert into business plans, investor pitch decks, or market analysis reports in the 'Market Overview' or 'Competitive Landscape' section. Edit bar heights and value labels to match your actual data, and update the legend labels (STEP 01, STEP 02) to reflect your specific categories.
-
Recommended For
Aerospace and defense industry executives, business development teams, and marketing professionals presenting market conditions to stakeholders. Suitable for investor presentations, internal strategy meetings, and industry research reports requiring credible data visualization.
-
Slide Structure
Both slides share the same layout: title area at top, vertical bar chart in the center (2 series × approximately 10 data points), and explanation section at bottom with 2 icons and accompanying text. Slide 1 uses pink and coral tones; Slide 2 features blue and purple variations for design flexibility.
Related Products
-

Vertical Bar Chart for Data Analysis Visualization – Efficiency and Practicality
#Market and Competitor Analysis #Graph #Competitor Analysis
-

Business Bundle Bar Graph – Market Analysis and Competitive Edge
#Market and Competitor Analysis #Graph #Competitor Analysis
-

Market Trend Visualized with Vertical Bar Graph
#Market and Competitor Analysis #Graph #Competitor Analysis
-

Blue Orange Competitive Analysis Bar Graph
#Market and Competitor Analysis #Graph #Competitor Analysis
