Earth Analysis Donut Circle Graph – Enhancing Market Competitiveness
RJ0700003_22
- Last Update 07/22/2025
- File Size 0.4MB
- # of Slides 2
- File Format PPTX
- Slide Ratio 16:9
- Color
Keywords
- #Content-Based Slides
- #Design-Based Slides
- #Market and Competitor Analysis
- #Graph
- #Competitor Analysis
- #Competitive Advantage
- #Circles
- #Doughnut Chart
- #16:9
- #donut chart PowerPoint slide
- #donut graph template
- #earth market analysis chart
- #pie chart alternative
- #global data visualization
- #circular chart PPT template
About the Product
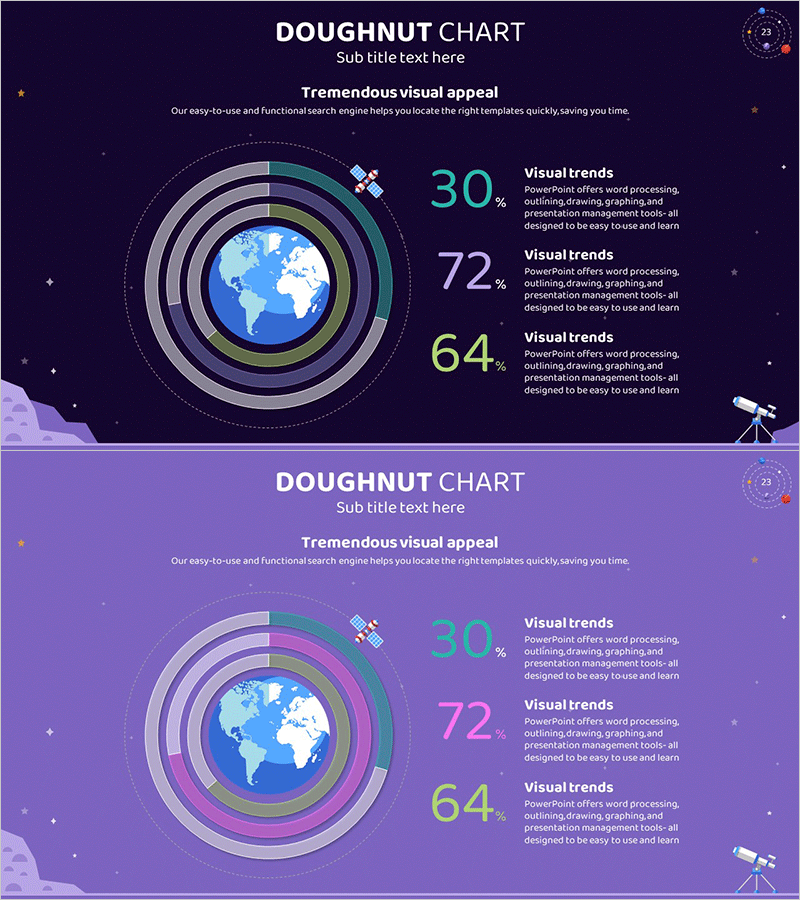
A 3-segment donut chart PowerPoint slide with a world map centered in the design. Set against a dark navy background, concentric rings in teal, gray, and lime green represent data proportions, with percentage labels (30%, 72%, 64%) and descriptive text positioned on the right. Ideal for global market competitiveness analysis, regional market share comparison, and competitive benchmarking in international business presentations. Provided in 16:9 widescreen format with 2 slides, fully editable colors, values, and text.
Usage Points
-
Main Usage
Visualizes proportional data across three categories—global market share, regional revenue distribution, competitive performance metrics, or international customer segments. The centered world map emphasizes international business context, while concentric rings intuitively represent hierarchical data layers.
-
How to Use
Place in investor pitch decks, quarterly business reports, marketing strategy presentations, or executive dashboards during global data analysis sections. Customize the right-side text area with category descriptions and insights, and adjust ring colors to match data categories or corporate branding.
-
Recommended For
International business managers, marketing strategists, executives, management consultants, and academic presenters communicating global market analysis, competitive positioning, or regional performance metrics. Particularly valuable for multinational corporations, export-import businesses, and global marketing campaign planning.
-
Slide Structure
2-slide set. Slide 1: Dark navy background, centered world map, 3 concentric rings (teal, gray, lime green), 3 percentage labels (30%, 72%, 64%) with descriptive text on right. Slide 2: Color variant (lavender, pink, lime green). 16:9 widescreen format, all elements fully editable.
Related Products
-

Core Transport Competitiveness Analysis – Intuitive Visualization with Graphs
#Market and Competitor Analysis #Graph #Competitor Analysis
-

Banking Services Sector Analysis Graph – Market and Competitor Analysis
#Market and Competitor Analysis #Graph #Competitor Analysis
-

Donut Chart for Market and Competitor Analysis – Color Theme Presentation
#Market and Competitor Analysis #Graph #Competitor Analysis
-

Doughnut Chart Visualized with Leather Material – Highlighting Competitive Edge
#Market and Competitor Analysis #Graph #Competitor Analysis
