Future Planning Flow Diagram – Vision and Roadmap
RJ0600109_26
- Last Update 07/20/2025
- File Size 0.2MB
- # of Slides 2
- File Format PPTX
- Slide Ratio 16:9
- Color
Keywords
About the Product
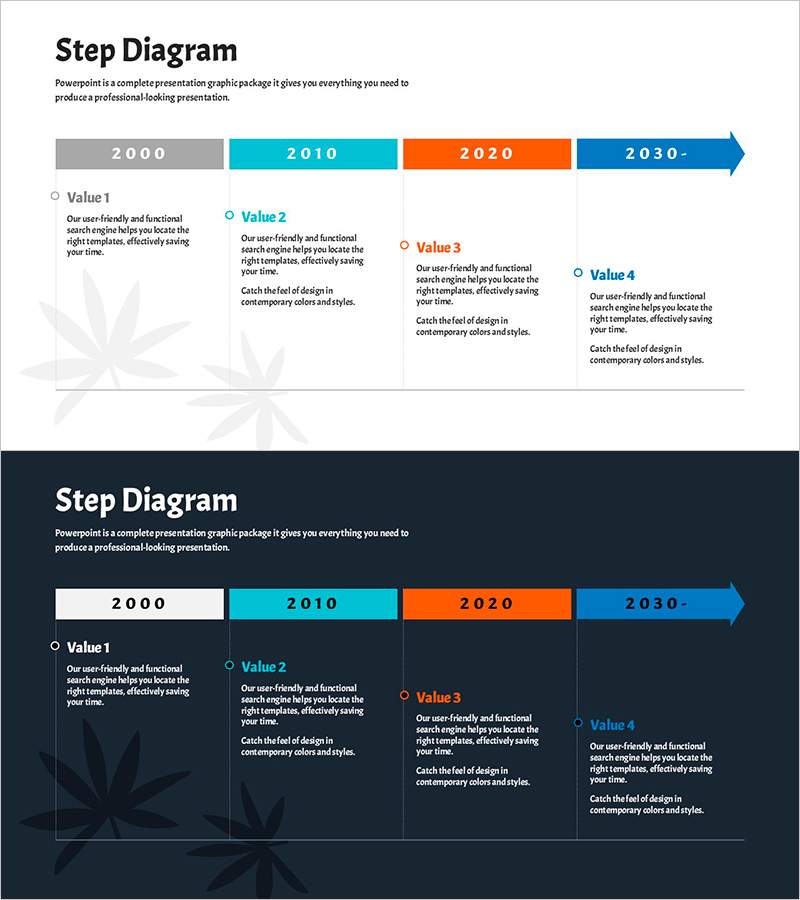
A PowerPoint slide presenting a future plan from 2000 to 2030 in a 4-step linear flow structure. Four distinct colors—gray, cyan, orange, and blue—differentiate each phase, while the arrow direction clearly conveys time progression and direction of execution. Below each phase box, Value 1–4 description areas allow detailed documentation of strategic objectives, implementation details, and performance metrics. Two versions are provided: light and dark backgrounds, enabling selection based on presentation environment. Fully editable and ready for immediate use.
Usage Points
-
Main Usage
Ideal for visualizing year-by-year and phase-by-phase future plans, vision roadmaps, and strategic execution timelines. Enables parallel comparison of four key objectives and outcomes across time periods while using arrow direction to intuitively convey progression flow.
-
How to Use
Replace the year labels (2000, 2010, 2020, 2030-) with your actual time periods. Fill the Value 1–4 areas with corresponding strategic goals, implementation tasks, and performance indicators. Colors and text sizes are fully customizable. Choose between light or dark background versions to match your presentation venue.
-
Recommended For
Suitable for executive reports, business plan presentations, strategic planning meetings, investor pitch decks (IR), and organizational vision-sharing sessions. Particularly effective for explaining medium-to-long-term plans, digital transformation roadmaps, new business initiatives, and organizational growth phases.
-
Slide Structure
2-slide set. Each slide features a linear flow structure with 4 phase boxes (nodes) and a right-pointing arrow. Below each box, a circular icon and 4 text input areas enable detailed phase-specific information. Optimized for modern presentations in 16:9 widescreen format.
Related Products
-

Business Field and Organization Flow Chart – Effective Organizational Management
#Company Introduction #Technical Approach #Diagram
-

Step-by-step Schedule Diagram – Flow of Business Strategy
#Business Strategy #Operational Plan #Diagram
-

Business Area Circular 3D Diagram – Introducing Strategic Vision
#Business Introduction #Business Vision and Strategy #Diagram
-

Business Vision and Goals Slide – Cluster Diagram
#Business Vision and Strategy #Diagram #Business Vision
