Blue Orange Positioning Slide - Data Visualization and Marketing Strategy
RJ0600109_22
- Last Update 07/20/2025
- File Size 0.3MB
- # of Slides 2
- File Format PPTX
- Slide Ratio 16:9
Keywords
About the Product
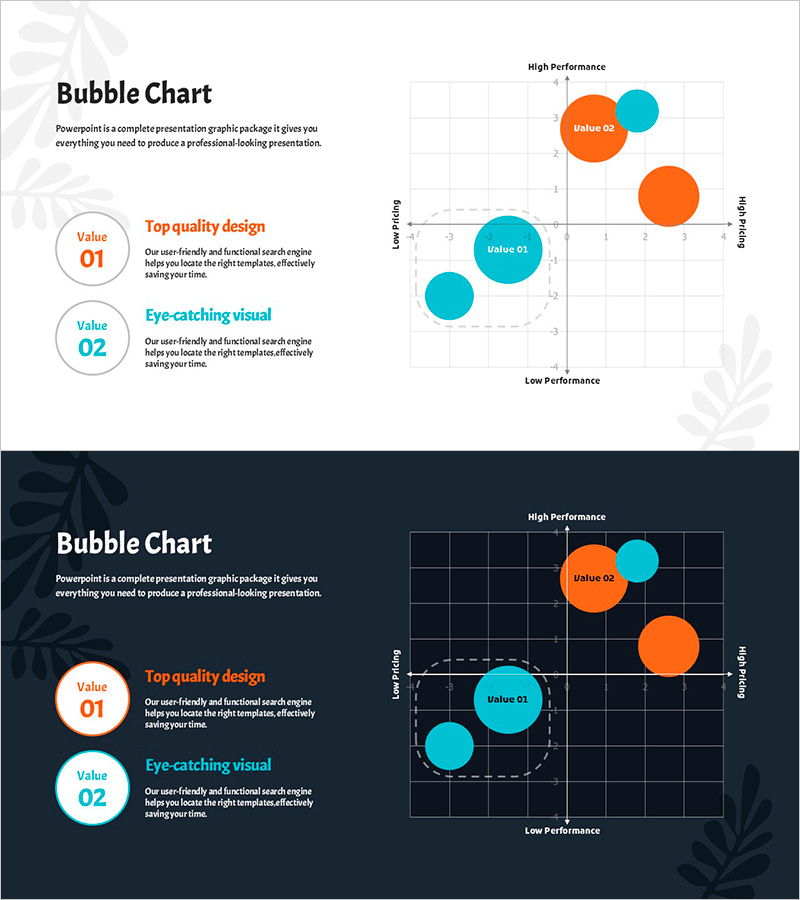
A positioning analysis slide designed for marketing strategy and data visualization. This 2-slide set provides both light and dark background versions for flexible presentation contexts. The bubble chart layout divides the space into four quadrants (High/Low Performance × Low/High Value) to visualize competitive positioning, product portfolio analysis, and market segmentation. Fully editable circular bubbles and text fields in PowerPoint allow quick customization. The blue and orange two-tone color scheme clearly distinguishes data categories and creates visual hierarchy. Ideal for marketing strategy presentations, business reports, investor pitches, and executive briefings where data-driven decision-making is critical.
Usage Points
-
Main Usage
Visualize product or service market positioning across four quadrants using bubble chart format to compare competitive advantage, performance levels, and value perception at a glance. Effectively supports marketing strategy development, portfolio optimization, and investment decision-making with data-driven insights.
-
How to Use
Use the light background slide for general presentations and the dark background version for executive-level briefings. Adjust bubble size, position, and color to match your data, then add legend and axis labels to clearly communicate analysis findings.
-
Recommended For
Marketing managers, strategy planning teams, product managers, and business development professionals conducting competitive analysis, market segmentation, portfolio evaluation, and new product launch strategy planning.
-
Slide Structure
2-slide set: light background version (title area, left-side description with 2 text fields, right-side 4-quadrant bubble chart) and dark background version with identical layout. Each slide includes 5 editable bubble areas, axis labels, and quadrant dividing lines for clear data organization.
Related Products
-

Positioning Map – Market Analysis and Strategy
#Market and Competitor Analysis #Marketing Plan and Strategy #Diagram
-

Security Risk Matrix – Operations and Marketing Strategy
#Operational Plan #Marketing Plan and Strategy #Graph
-

Positioning Point Area Graph – Strategy for Market Analysis
#Market and Competitor Analysis #Marketing Plan and Strategy #Diagram
-

Positioning Analysis for Market Entry – Target Customer Segmentation Strategy
#Marketing Plan and Strategy #Graph #Other
