Spring Survey Graph for Market Share Analysis
RJ0600104_9
- Last Update 07/19/2025
- File Size 0.3MB
- # of Slides 2
- File Format PPTX
- Slide Ratio 16:9
- Color
Keywords
About the Product
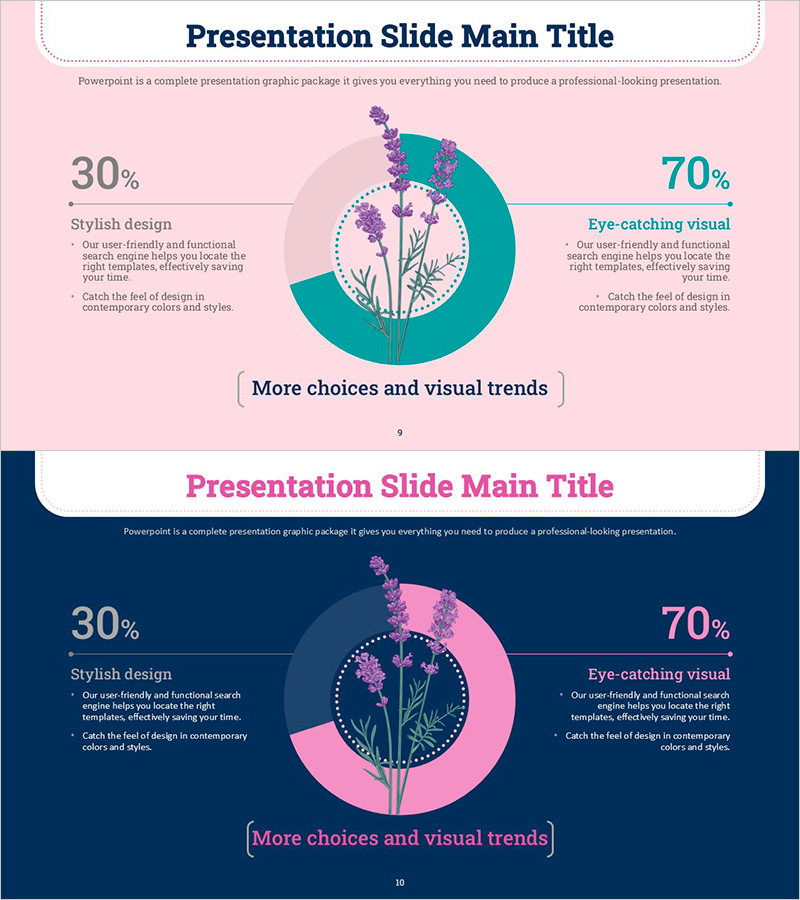
A donut chart PowerPoint slide template for visualizing spring survey data and market share analysis. The circular chart is divided into two segments using pink and teal colors, representing 30% (stylish design) on the left and 70% (eye-catching visual) on the right. This presentation slide includes floral illustrations and dotted borders to convey a spring theme, making it ideal for business analysis, market research reports, and customer preference surveys. The template is ready to download and edit, allowing you to input your own data and customize the text areas for immediate use in professional presentations.
Usage Points
-
Main Usage
Visualize two-item ratio comparisons such as market share, customer preferences, and survey results using a donut-shaped pie chart. The hollow center allows you to insert additional text, icons, or key metrics to emphasize important data points.
-
How to Use
Use this slide in business analysis reports, marketing presentations, and market research briefings to communicate data ratios intuitively. Edit the text areas on the left and right to add item names and descriptions, then adjust the chart values to match your actual data. Suitable for seasonal promotions, quarterly analysis, and customer segmentation reports.
-
Recommended For
Marketing managers, business analysts, sales directors, and market research professionals presenting survey findings or market share data to executives and clients. Ideal for quarterly performance reviews, product preference studies, and customer satisfaction assessments.
-
Slide Structure
Two-slide template featuring pink background (top) and navy background (bottom) color themes. Each slide displays a centered donut chart with two segments, left text area for 30% item, right text area for 70% item, and decorative floral elements with dotted borders.
Related Products
-

Donut Chart Slide for Furniture Preferences Survey
#Market and Competitor Analysis #Graph #Market Share
-

Camping Tools Infographic Donut Chart – Market Share Analysis
#Market and Competitor Analysis #Graph #Market Status
-

Palm Donut Chart – Market Share and Data Visualization
#Market and Competitor Analysis #Graph #Market Share
-

Travel Destination Infographic Market Share – Intuitive Data Visualization
#Market and Competitor Analysis #Graph #Market Share
