Required Funding Plan for Summer Vacation Travel – Setting Financial Goals
RJ0600102_20
- Last Update 07/18/2025
- File Size 1.2MB
- # of Slides 2
- File Format PPTX
- Slide Ratio 16:9
- Color
Keywords
- #Content-Based Slides
- #Design-Based Slides
- #Financial Plans and Performance
- #Diagram
- #Capital Requirements
- #Budget
- #Table
- #16:9
- #financial data table PowerPoint slide
- #budget comparison presentation
- #multi-row data table PPT
- #how to create a financial table in PowerPoint
- #expense tracking slide template
- #financial metrics visualization
About the Product
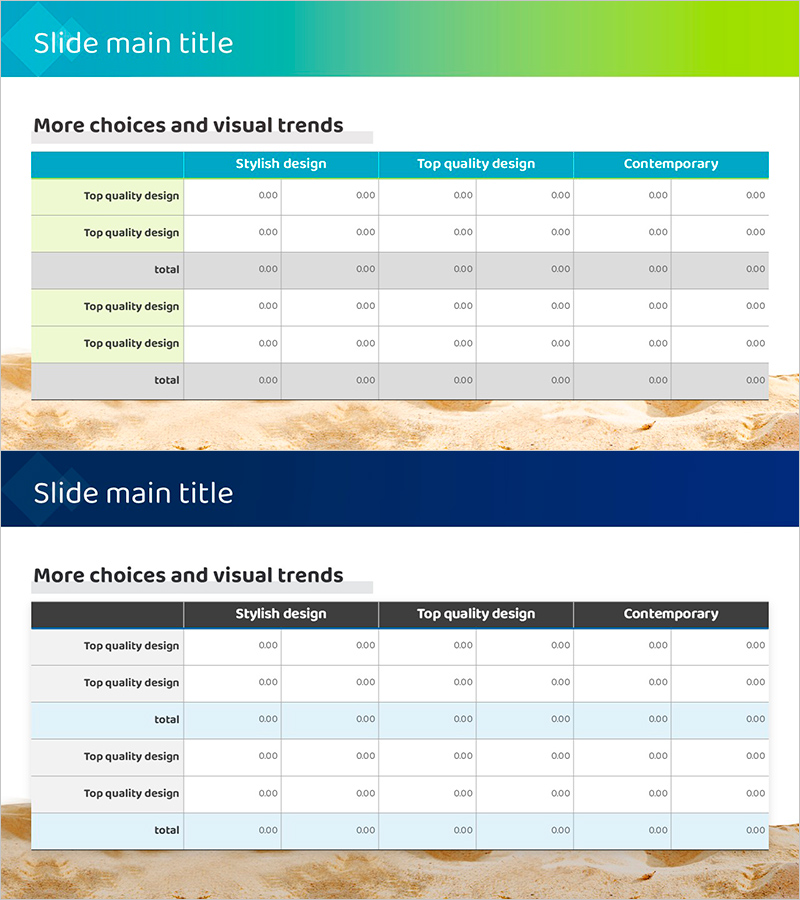
A versatile PowerPoint slide designed for presenting financial data, from summer vacation budgets to corporate financial analysis. Features a teal header row and color-coded background rows in a 6-column table structure, with dedicated rows for subtotals and grand totals. The layout clearly separates data categories and enables quick numerical comparisons across multiple dimensions. Fully editable text fields allow immediate customization for budget planning, funding requirements, ROI analysis, and other financial metrics. Provided in 16:9 widescreen PPTX format, optimized for financial presentations and investor reports.
Usage Points
-
Main Usage
Present financial data systematically in corporate reports, investment proposals, and budget planning presentations. The multi-row structure with subtotal and total rows enables stakeholders to quickly compare figures across categories and make data-driven decisions.
-
How to Use
Enter financial figures (budget amounts, ROI percentages, cash flow data) directly into the table cells. Add category names in the header row, input numerical data in the corresponding rows, calculate and insert subtotals and grand totals. The color-coded rows automatically organize information by category.
-
Recommended For
CFOs, financial managers, and executives presenting financial performance to investors, boards, and stakeholders. Also suitable for project cost estimation, marketing budget allocation, event planning budgets, and departmental expense reports.
-
Slide Structure
Teal header row (1) + data entry rows (5) + subtotal row (1) + additional data rows (2) + grand total row (1). Six columns accommodate category labels and five data columns for flexible financial metric comparisons across different dimensions.
Related Products
-

Global Travel Market Trends – Insights Through Data Visualization
#Financial Plans and Performance #Diagram #Graph
-

Table Chart and Arrow Signs
#Financial Plans and Performance #Diagram #Capital Requirements
-

Mountain Climbing Table for Financial Planning and Performance
#Financial Plans and Performance #Diagram #Capital Requirements
-

Estimated Budget Breakdown – Financial Planning and Budget Management
#Financial Plans and Performance #Diagram #Capital Requirements
