Tree Population Graph – Visualizing Competitive Advantages
RJ0600099_15
- Last Update 07/17/2025
- File Size 0.3MB
- # of Slides 2
- File Format PPTX
- Slide Ratio 16:9
- Color
Keywords
About the Product
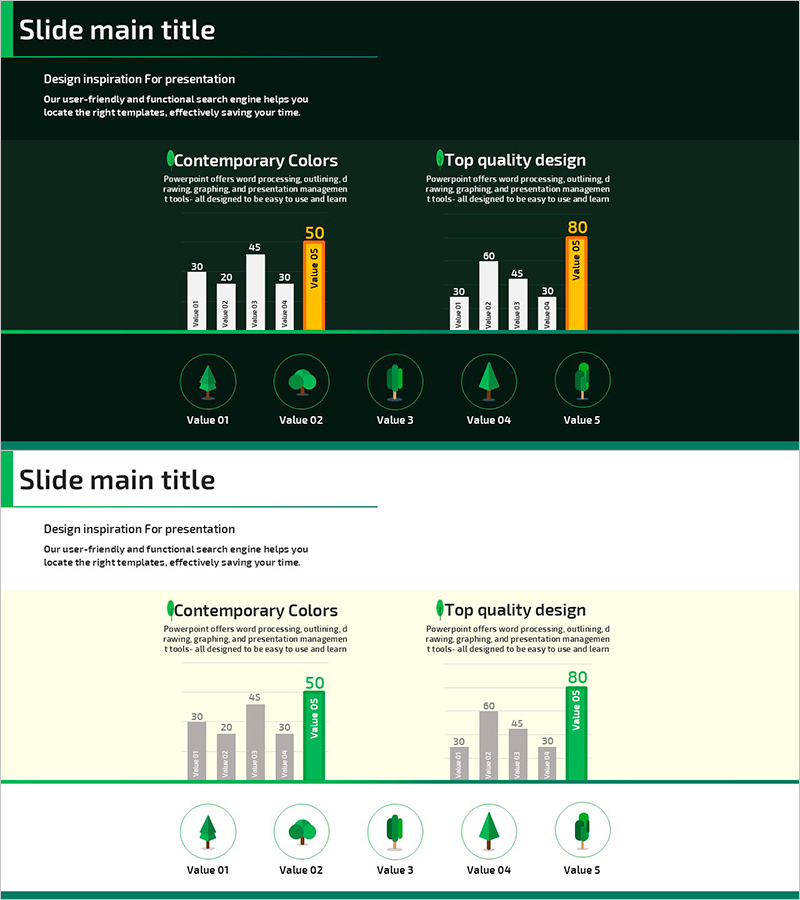
A vertical bar chart PowerPoint slide designed to visualize competitive advantages and market analysis. The slide features a dark green background with white bars and yellow accent colors, clearly presenting numerical comparisons across 5 items. Each bar displays data labels at the top, while the bottom section includes 5 category icons as infographic elements. This presentation slide is ready to use in data comparison sections of business reports and pitch decks.
Usage Points
-
Main Usage
Visualize numerical data across 5 items using a vertical bar chart to highlight competitive advantages, market share, performance metrics, and key indicators at a glance. The dark green background and yellow accent color emphasize important figures.
-
How to Use
Insert this slide into business plans, marketing proposals, and quarterly performance reports in the data analysis section. Double-click each bar to replace values with actual data, and edit the legend and title to match your presentation context.
-
Recommended For
Executives, marketing managers, sales teams, consultants, and data analysts who need to communicate quantitative results persuasively. Ideal for quarterly performance presentations, competitive analysis comparisons, and market research findings.
-
Slide Structure
2-slide layout: First slide features a dark green background divided into 2 sections (Contemporary Colors, Top quality design) with 5 vertical bars each. Second slide uses a cream background with identical structure. Bottom section displays 5 category icons as tree-shaped infographic elements.
Related Products
-

India Travel Vertical Bar Graph – Visual Appeal of Green and Red
#Market and Competitor Analysis #Financial Plans and Performance #Graph
-

Online Presentation Template Comparison Chart – Visualizing Competitive Analysis
#Market and Competitor Analysis #Graph #Competitor Analysis
-

Modern Business Plan Template – Clustered Column Graph
#Market and Competitor Analysis #Graph #Market Analysis
-

Carbon Neutral Market Share Chart – Visualizing Competitive Advantage
#Market and Competitor Analysis #Diagram #Graph
