Expenses for Sports Activities Budget Slide – Visualizing Financial Plans
RJ0600094_24
- Last Update 07/16/2025
- File Size 1.2MB
- # of Slides 2
- File Format PPTX
- Slide Ratio 16:9
- Color
Keywords
About the Product
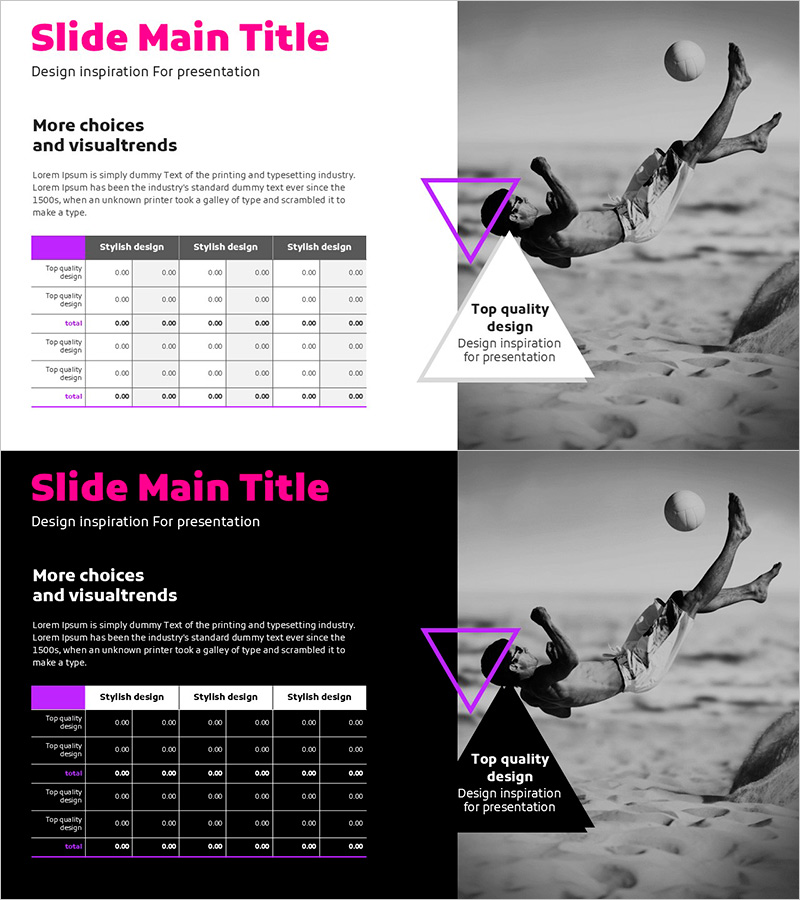
A 2-slide PowerPoint presentation designed to visualize sports activity expenses and financial planning. The design combines a magenta header with grayscale background imagery, creating a two-tone aesthetic with balanced left-side text area and right-side image space. The upper table displays numerical data across 6 columns for clear cost-item comparison, while triangular accent elements highlight key information. Ready to use as presentation slides, financial reports, or budget documentation. Adaptable for expense management meetings, financial planning presentations, and cost analysis discussions across various business contexts.
Usage Points
-
Main Usage
Clearly visualizes financial data and budget status through numerical representation. The magenta header and table structure enable effective cost-item comparison analysis, supporting credible data presentation for investors, executives, and team members during financial reporting and budget review meetings.
-
How to Use
Enter budget item names, descriptions, and key details in the left text area. Input numerical data (amounts, percentages, variances) into table cells. Insert related photos, charts, or graphs in the right image space to enhance visual impact. Use magenta accent elements to highlight critical figures or important budget categories.
-
Recommended For
CFOs, finance managers, executives, project managers, and business planning teams preparing budget reports, financial plans, cost analysis presentations, quarterly financial reviews, and investment proposals. Effective for expense management presentations across sports, events, projects, and various organizational contexts.
-
Slide Structure
2-slide layout with each slide divided into left text input area (title and 3-4 lines of description) and right image space (16:9 ratio). Magenta header area at top for slide titles. Central table features 6 columns × 5-6 rows for data entry. Triangular accent elements and grayscale background maintain consistent visual tone throughout.
Related Products
-

Diet Meal Table – Healthy Financial Planning
#Financial Plans and Performance #Diagram #Budget
-

Key Financial Indicators and Budget Slide – A Harmony of Blue and Red
#Financial Plans and Performance #Diagram #Budget
-

Travel Table Text Box – Visualizing Financial Plans and Outcomes
#Financial Plans and Performance #Diagram #Budget
-

Financial Indicator Text Table – Financial Performance Analysis
#Financial Plans and Performance #Diagram #Budget
