Competitive Advantage Analysis Bar Chart – Visualization Emphasizing Market Competition
RL0100048_3
- Last Update 01/21/2025
- File Size 2.1MB
- # of Slides 2
- File Format PPTX
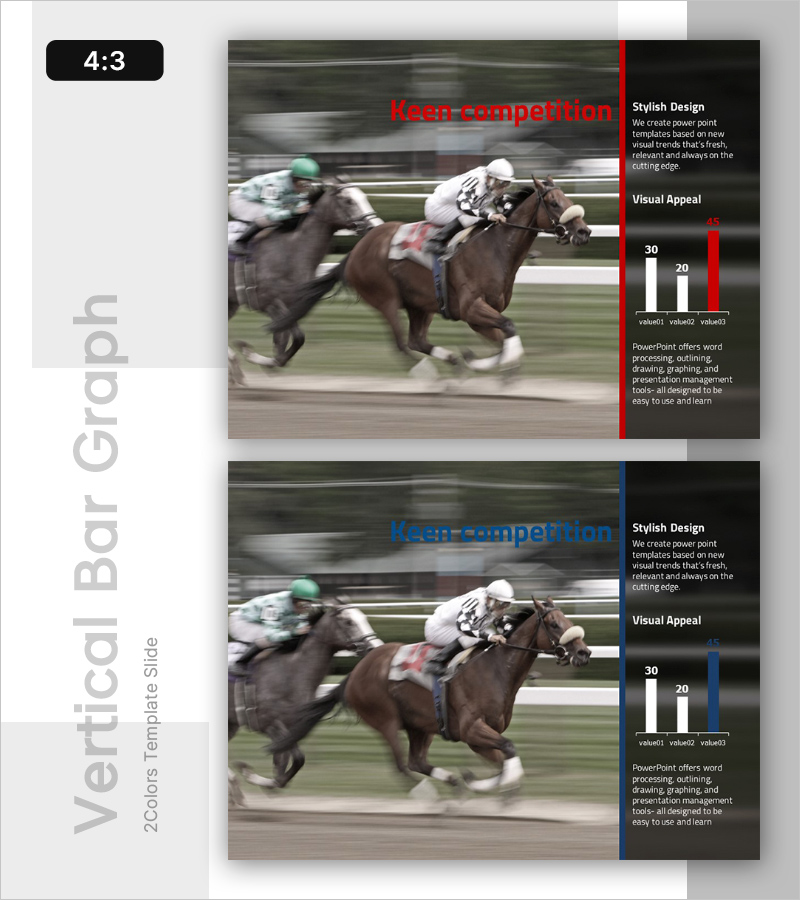
- Slide Ratio 4:3
- Color
Keywords
About the Product
A 2-slide PowerPoint presentation that visualizes market competition and competitive positioning with clarity and impact. The bar chart uses red and blue color coding to distinguish between your company and competitors, making advantage gaps immediately apparent. The asymmetrical layout—with title and description on the left and chart data on the right—creates a clear information hierarchy. In 4:3 PPTX format, these slides integrate seamlessly into existing presentations for executive briefings, investor pitches, and strategic planning sessions. All chart data and text fields are fully editable, enabling quick adaptation across industries and market segments.
Usage Points
-
Main Usage
This slide clearly communicates your company's competitive strengths against rivals using data-driven bar charts. The height differences in bars instantly convey competitive gaps, while red accent colors highlight key advantages. Ideal for executive reports, investor presentations, and strategic planning meetings where market positioning must be presented with credibility and visual impact.
-
How to Use
Enter your analysis topic (e.g., technology, pricing, customer satisfaction) in the left title area. Replace the chart legend and values with your company name and competitor names. Add analysis findings and strategic implications in the text box below. Customize colors, fonts, and chart styling to match your existing presentation template for visual consistency.
-
Recommended For
Perfect for executives, business development teams, marketing departments, and strategic planning units presenting competitive analysis. Particularly valuable during new market entry evaluation, product positioning strategy, and competitive landscape assessment. Highly effective for investor and partner presentations where demonstrating clear market differentiation is critical.
-
Slide Structure
Two-slide layout with left-side title and description area paired with right-side bar chart and text field. First slide features red accent color; second uses blue accent to distinguish separate analysis topics. Each chart optimizes 3–5 item comparisons. Text areas accommodate analysis results, key insights, and strategic recommendations with ample space for detailed commentary.


