Activity Table – Visual Diagram
RJ0600091_29
- Last Update 07/15/2025
- File Size 0.1MB
- # of Slides 2
- File Format PPTX
- Slide Ratio 16:9
- Color
Keywords
About the Product
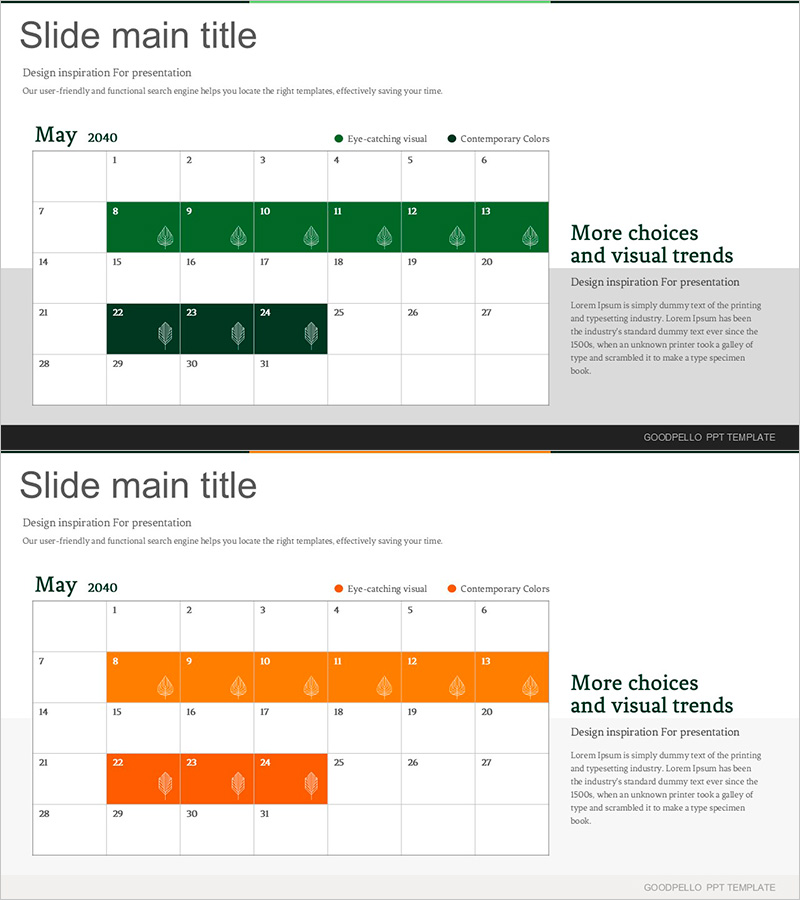
A visual table diagram PowerPoint slide designed for monthly activity planning and scheduling. Available in two color versions—forest green and vibrant orange—with calendar-style grid layout and icon elements to highlight each activity. This 16:9 widescreen 2-slide set enables you to present project timelines, team activity schedules, marketing campaign calendars, and operational plans with clarity. Text and number fields are fully editable, making it ready to use immediately in presentations, business proposals, and planning documents.
Usage Points
-
Main Usage
Visualize monthly or quarterly activity schedules in a calendar-style table format to communicate the complete plan to team members at a glance. Icons placed in each activity cell create clear information hierarchy, while color differentiation can represent activity types or priority levels.
-
How to Use
The base table structure remains fixed; customize the dates and activity names to match your presentation purpose. Select either the green or orange color version to align with your brand identity, then add icons and text to represent team activities, project milestones, marketing events, or operational schedules.
-
Recommended For
Project managers, marketing professionals, team leaders, and planners presenting monthly or quarterly activity schedules. Ideal for business plans, marketing proposals, project pitches, team meeting materials, and operational reports where timeline visualization is essential.
-
Slide Structure
Two-slide set with a 7-row by 6-column calendar-style table on each slide. Header includes month and year label, day-of-week columns (1–6), and week numbers (7–31) on the left. Each cell accommodates activity icons and text input. Two color themes provided: forest green and orange.
Related Products
-

Introduction to Organizational Structure & Roles – System Composition and Efficiency
#Company Introduction #Technical Approach #Diagram
-

Achievements by Business Year – Systematic Cluster Diagram
#Company Introduction #Business Strategy #Diagram
-

Competitor Analysis and Differentiation Strategy Diagram
#Market and Competitor Analysis #Diagram #Graph
-

PowerPoint Template for Service Operation Strategy Presentation
#Business Management #Operational Plan #Technical Approach
