Diagram Slide for Analyzing Injury Rate during Hiking
RJ0600090_23
- Last Update 07/14/2025
- File Size 1.6MB
- # of Slides 2
- File Format PPTX
- Slide Ratio 16:9
- Color
Keywords
About the Product
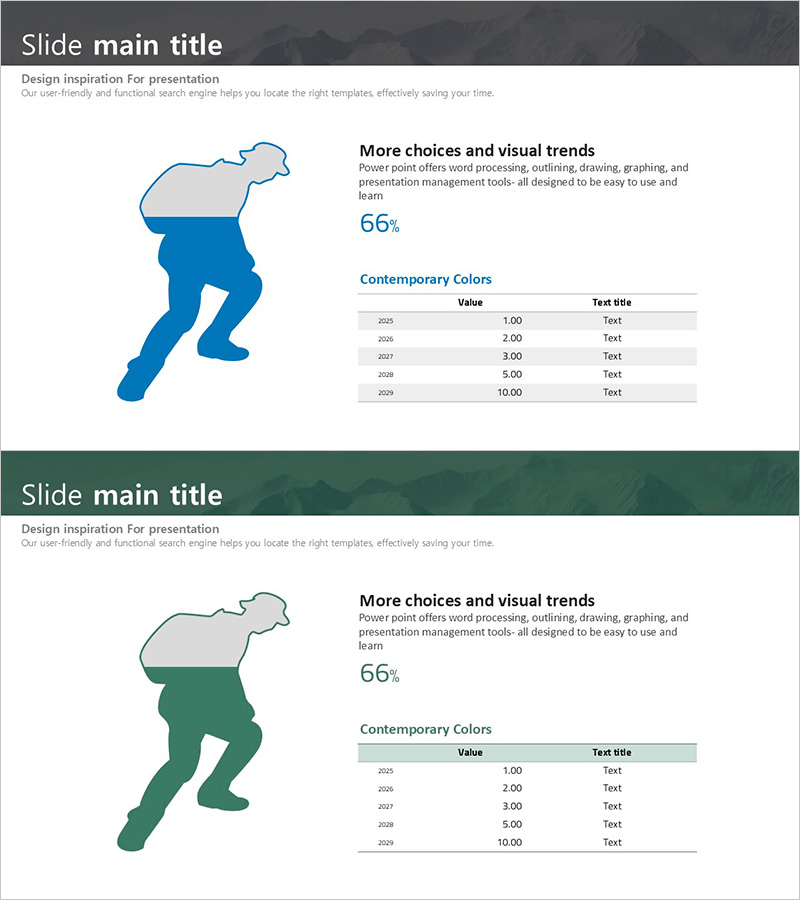
A PowerPoint slide designed to compare year-over-year numerical data such as injury rates, market share, and competitor performance at a glance. The layout features a left-side silhouette illustration paired with a right-side data table in a two-column structure that enhances information clarity. Available in both blue and green color versions, each slide includes an editable table structure with fields for annual values (Value) and item names (Text title). Ready to use immediately in business plans, market analysis reports, and competitive analysis presentations.
Usage Points
-
Main Usage
Visually compare year-over-year numerical data such as injury rates, market share, and competitor performance to support decision-making. The two-column layout with left silhouette and right data table clearly establishes information hierarchy and improves audience comprehension.
-
How to Use
Enter annual data (2025–2029) and numerical values into the table fields, and input analysis subject names in the Text title column. Select either the blue or green version to match your presentation's brand colors. The silhouette illustration can be replaced to reflect your analysis subject (hikers, market participants, competitors).
-
Recommended For
Recommended for business plans, investment pitch decks, and marketing strategy presentations that require market analysis, competitive analysis, or customer behavior analysis sections. Particularly effective for executive reports and strategic planning meetings where year-over-year trends or multi-item comparisons are needed.
-
Slide Structure
Two-slide set with each slide featuring a left-side silhouette illustration (height adjustable) and a right-side data table (5 rows × 3 columns). The table header row (Value, Text title) and data rows (2025–2029 annual figures) are fully editable. Optimized for 16:9 widescreen format.
Related Products
-

Businessperson Work Ability Analysis Graph – Successful Ability Assessment
#Product/Service Introduction #Market and Competitor Analysis #Diagram
-

Slide for Analysis of Hiking Dog Utilization
#Market and Competitor Analysis #Diagram #Other
-

Participation Rate and Exercise Schedule – Efficient Operations Plan
#Operational Plan #Market and Competitor Analysis #Diagram
-

A Chart for the Total Population – Effective Market Analysis
#Market and Competitor Analysis #Diagram #Graph
