Climbing Area Graph – Market Trend Analysis
RJ0600090_12
- Last Update 07/14/2025
- File Size 1.7MB
- # of Slides 2
- File Format PPTX
- Slide Ratio 16:9
- Color
Keywords
About the Product
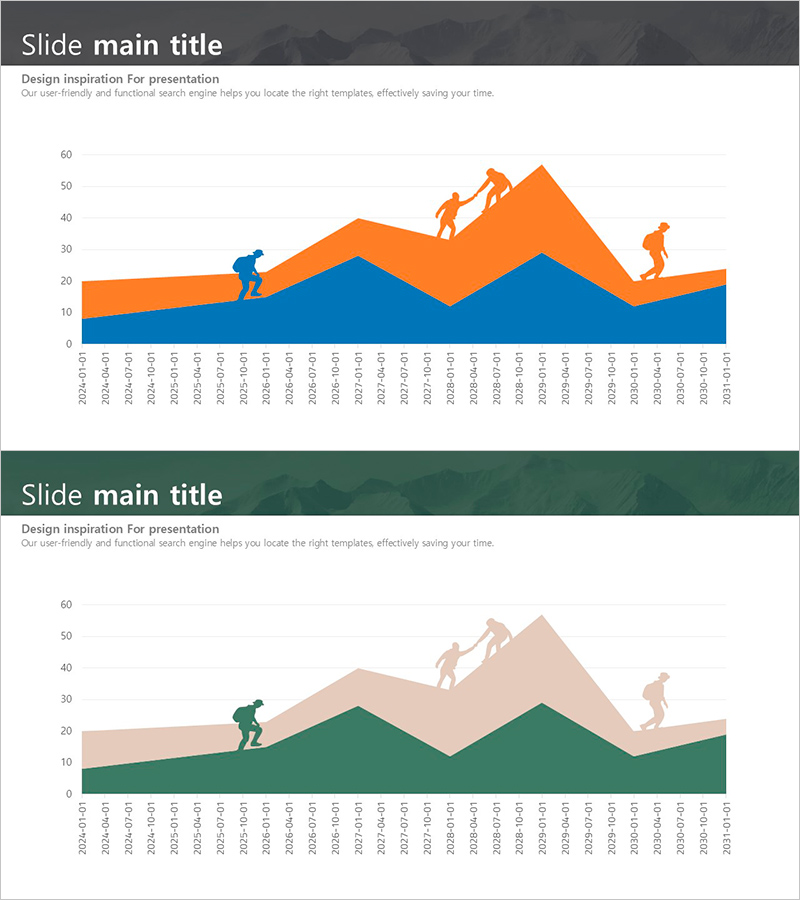
An area chart PowerPoint slide designed for market trend analysis and competitive comparison. This presentation template features a dual-layer stacked area chart in blue and orange, effectively visualizing how two data series evolve over time. The dark gray header and white background maximize data readability, while the monthly time-series layout supports clear trend identification. Ideal for investor presentations, quarterly business reports, market analysis decks, and competitive positioning slides. The chart automatically updates when you input your data, making it ready for immediate use in PPTX format. Perfect for displaying market share shifts, revenue trends, competitive metrics, and other business KPIs that require time-based comparison.
Usage Points
-
Main Usage
Visualize market trends, competitive comparisons, revenue growth, and market share evolution using time-series data across two categories. The stacked area format simultaneously shows total volume and individual category proportions, making it highly effective for data-driven decision-making and strategic insights.
-
How to Use
Double-click the chart to enter edit mode and input your data. Set the X-axis to your time periods (monthly, quarterly, annual) and populate the Y-axis with values for both comparison categories (e.g., your company vs. competitor, Product A vs. Product B). Customize colors and legend labels as needed to match your brand or presentation theme.
-
Recommended For
Business reports, investor relations presentations, marketing strategy pitches, market analysis documents, quarterly earnings calls, and competitive landscape briefings. Particularly valuable for executive summaries, shareholder meetings, board presentations, and partner collaboration sessions where trend visualization is critical.
-
Slide Structure
Title and subtitle text areas occupy the top section. The main content area features a stacked area chart with monthly time-series data on the X-axis and numerical values on the Y-axis. Two distinct colored layers (blue base, orange overlay) represent the two data categories, with clear axis labels and gridlines for easy data interpretation.
Related Products
-

Future Outlook Line Graph Blue Orange
#Market and Competitor Analysis #Graph #Other
-

Marketing Effectiveness Analysis Mixed Graph – Insights into Market Trends
#Market and Competitor Analysis #Graph #Other
-

Market Trend Analysis Area Graph – Market and Competitive Analysis
#Company Introduction #Market and Competitor Analysis #Graph
-

Carbon Neutral Market Analysis Chart – Brown Blue Design
#Market and Competitor Analysis #Graph #Other
