Inclusion and Nesting Diagrams – Clearly Presenting Relationships in Information
RB0800008-1_29
- Last Update 03/19/2025
- File Size 1.7MB
- # of Slides 2
- File Format PPTX
- Slide Ratio 4:3
- Color
Keywords
- #Content-Based Slides
- #Design-Based Slides
- #Product/Service Introduction
- #Diagram
- #Features
- #Composition
- #Cluster
- #Inclusive Cluster Diagram
- #4:3
- #inclusion diagram PowerPoint
- #nesting diagram slide
- #cluster visualization
- #circular diagram template
- #relationship diagram presentation
- #PowerPoint diagram slide design
About the Product
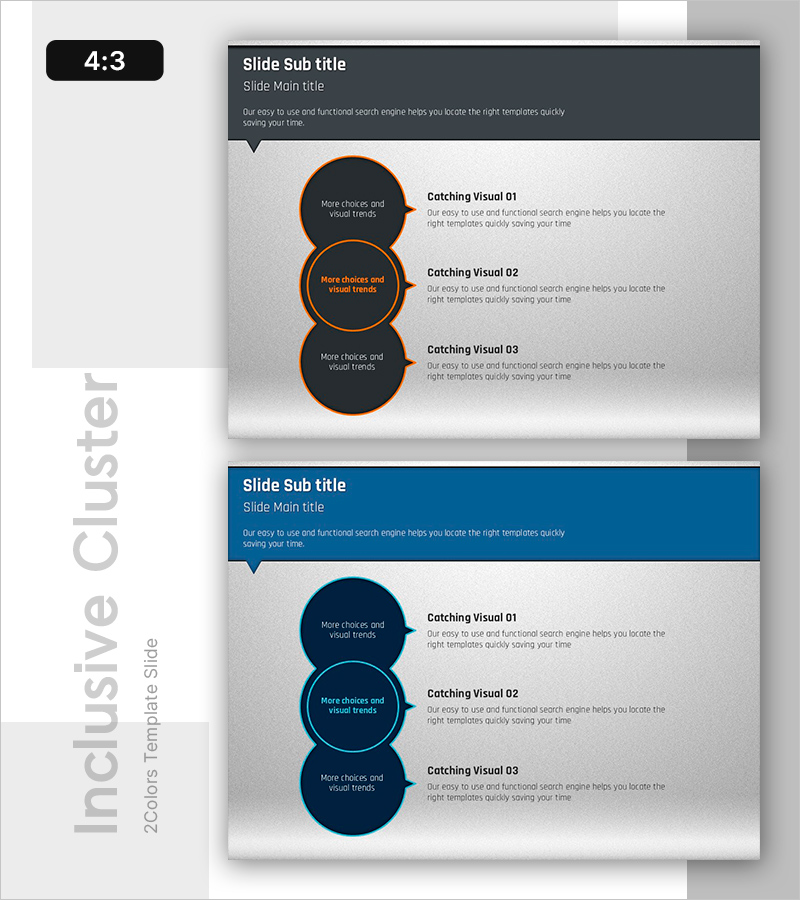
A nested circular diagram PowerPoint slide that visualizes hierarchical relationships using three overlapping circular nodes. Designed with a dark gray background and orange borders for emphasis, each circle contains text areas and callout connectors to clearly illustrate information inclusion relationships. This 4:3 aspect ratio, 2-slide set is ready to use in business reports, educational materials, organizational structure presentations, and various professional contexts. Fully editable in PowerPoint format, allowing you to customize colors, text content, and node sizes to match your specific presentation needs.
Usage Points
-
Main Usage
Optimized for visualizing organizational hierarchies, data inclusion relationships, and category classifications. Expresses three-level inclusion structures extending from a central concept, making complex information intuitive and easy to understand for audiences.
-
How to Use
Apply to organizational structure explanations in business reports, concept classifications in educational materials, target segmentation in marketing plans, and solution architecture descriptions in proposals. Customize the text within each circle and modify callout connectors to match your specific content requirements.
-
Recommended For
Recommended for executives, project managers, educators, marketing strategists, and consultants who need to clearly explain information structures and relationships. Particularly effective for presentations involving organizational relationships, system architectures, and categorical classifications.
-
Slide Structure
Two-slide set featuring the first slide with dark gray background and orange-bordered three nested circular nodes, and the second slide with dark blue background and light blue-bordered identical structure. Each node includes text input areas and right-side callout connectors for adding descriptive text.
Related Products
-

Two Nested Diagrams – Product Introduction and Composition
#Product/Service Introduction #Diagram #Features
-

Denim PPT Embedded Diagram
#Product/Service Introduction #Diagram #Features
-

Orange & Green Inclusion Diagram – Highlighting Product Features
#Product/Service Introduction #Diagram #Features
-

Circular Inclusion Diagram – Enhance Product and Service Presentations
#Product/Service Introduction #Diagram #Features
