Automotive Infographic Diagram – Introducing Visual Trends
RJ0600038_16
- Last Update 07/01/2025
- File Size 0.3MB
- # of Slides 2
- File Format PPTX
- Slide Ratio 16:9
- Color
Keywords
About the Product
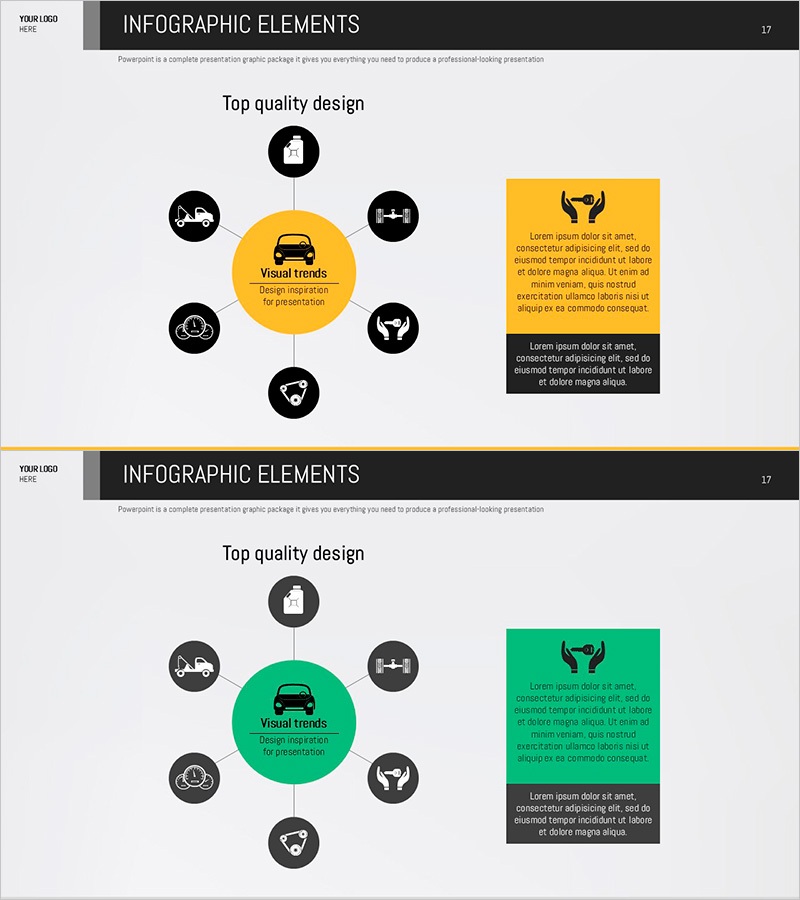
A PowerPoint slide featuring a radial diagram with a central circle and six black nodes arranged in a circular pattern. Each node displays automotive-related icons (vehicle, engine, safety, trends, technology, environment) for visual representation. The central circle is highlighted in yellow or green tones, creating strong contrast with the black nodes. A text box area on the right side allows for additional descriptions or key points. This slide design is ready for immediate use in automotive presentations, marketing materials, product introductions, and business reports.
Usage Points
-
Main Usage
Effectively communicates six key elements or categories radiating from a central concept. Ideal for presenting automotive business models, product features, marketing positioning, technology components, and strategic initiatives in a visually organized manner.
-
How to Use
Enter your core topic in the central circle (e.g., Visual Trends, Product Strategy, Brand Value), then add specific items to each of the six nodes using text or custom icons. Use the right-side text box to include supporting details, statistics, or explanations that enhance your presentation narrative.
-
Recommended For
Automotive marketing professionals, product planning teams, sales presenters, and executives preparing business reports. Suitable for industry analysis, competitive comparison, customer segmentation, technology roadmaps, and strategic planning presentations.
-
Slide Structure
Two-slide set with yellow-toned and green-toned central circles for design variation. Each slide includes six radial nodes, a central circle input area, and a two-section text box on the right. 16:9 widescreen format in PPTX, with all elements fully editable and customizable.
Related Products
-

Astronaut Characteristics Diagram – Product and Service Introduction
#Product/Service Introduction #Diagram #Features
-

Smartwatch Product Service Characteristics and Composition Diagram
#Product/Service Introduction #Diagram #Features
-

Planetary Analysis Diffusion Diagram – A Multidimensional Approach
#Product/Service Introduction #Diagram #Features
-

Diagram Slide Highlighting IT Service Characteristics and Contents
#Product/Service Introduction #Diagram #Features
