Animal Distribution Map – Market and Competitive Analysis
RJ0600087_13
- Last Update 07/13/2025
- File Size 3.9MB
- # of Slides 2
- File Format PPTX
- Slide Ratio 16:9
- Color
Keywords
About the Product
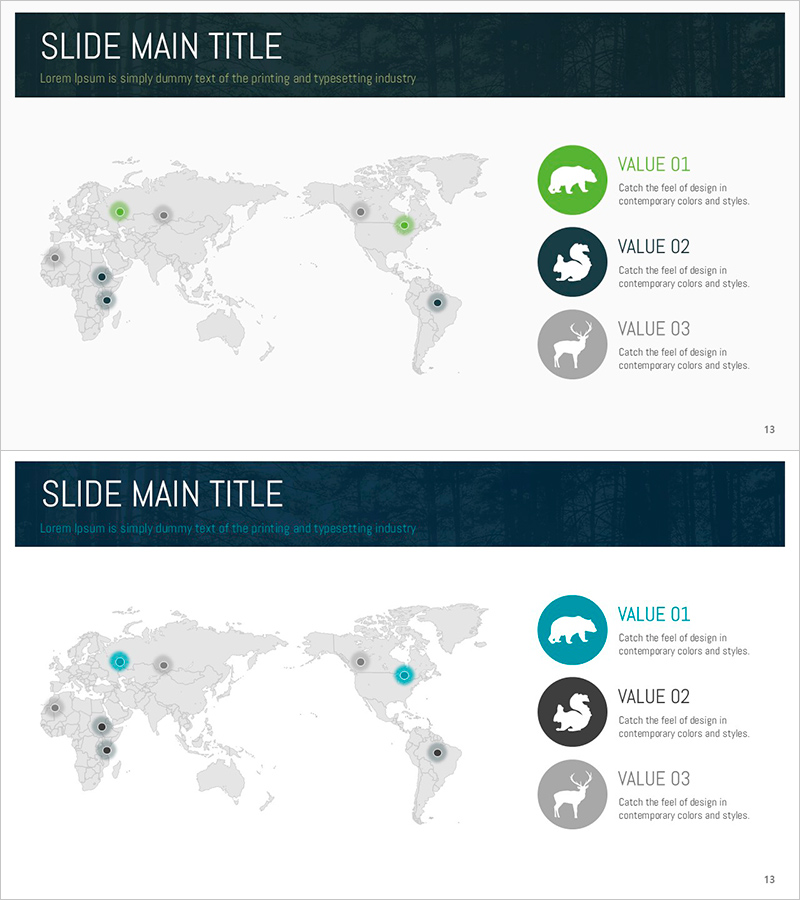
A PowerPoint slide that visualizes animal distribution across a world map background. Three circular icons in green, navy, and gray represent regional characteristics, with VALUE 01–03 text areas positioned to the right for intuitive communication of market analysis, competitive landscape, and global network information. Formatted in 16:9 widescreen PPTX with 2 slides, optimized for geographic data-driven comparative analysis presentations. Perfect for investor pitches, business reports, and marketing strategy sessions to clearly express global market positioning.
Usage Points
-
Main Usage
Geographically represents competitor, partner, and customer distribution across global markets. The animal icon branding creates memorable presentations while enabling stakeholders to grasp market expansion strategy and global network status at a glance.
-
How to Use
Reposition the circular icons on the world map to match your actual business regions, then populate the VALUE 01–03 text areas with regional market size, competitor names, or partner information. Customize colors to match corporate branding for maximum presentation impact.
-
Recommended For
Ideal for executives, sales teams, and strategic planners at globally-operating companies presenting investor pitches, business reports, or marketing strategies. Particularly suited for roles requiring visual explanation of regional market share, competitive positioning, and customer distribution.
-
Slide Structure
Two-slide layout featuring a world map background with three circular icons (green, navy, gray) and adjacent text areas. Dark header section accommodates title and subtitle, while map icon placement and right-side VALUE text create information hierarchy.
Related Products
-

Global Map Visualizing Country Distribution - Global Network Analysis
#Company Introduction #Market and Competitor Analysis #Other
-

Global Network Market Trends – Insights through Data Visualization
#Company Introduction #Market and Competitor Analysis #Graph
-

Global Network Introduction and Market Analysis – Business Reaching Out to the World
#Company Introduction #Market and Competitor Analysis #Diagram
-

Pixel Graphical Maps and Tables - Visualizing Global Network
#Company Introduction #Market and Competitor Analysis #Diagram
