Business Strategy and Key Points – Effective Design Diagram
RJ0600082_22
- Last Update 07/12/2025
- File Size 0.2MB
- # of Slides 2
- File Format PPTX
- Slide Ratio 16:9
- Color
Keywords
About the Product
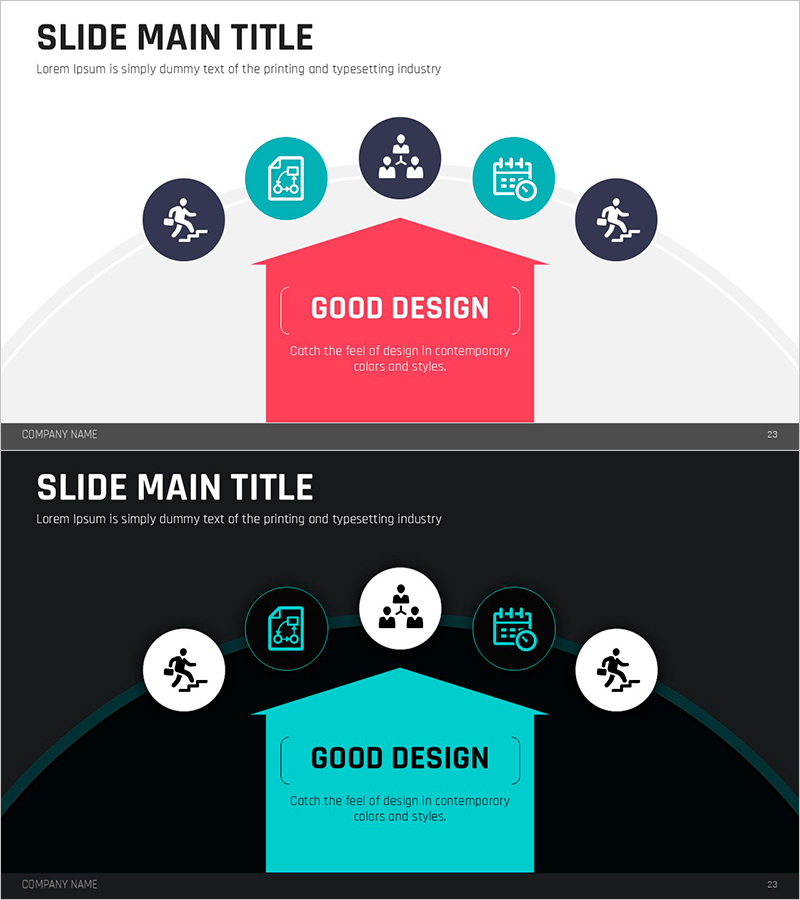
A radial diagram PowerPoint slide that visually organizes business strategy and key points with a central concept radiating to five directional nodes. This design effectively communicates strategic initiatives, core messages, and organizational objectives through a clear hierarchical structure. The composition features a coral-pink central box with dark navy and turquoise circular nodes, creating strong visual contrast that emphasizes information hierarchy. Icons representing documents, teams, schedules, and outcomes enhance intuitive understanding of each point. The 16:9 format with 2 slides is ready for immediate use in presentations, strategic plans, and business reports.
Usage Points
-
Main Usage
Presents organizational strategy by radiating five directional elements from a central concept. Ideal for expressing business objectives, implementation strategies, key performance indicators, organizational roles, and execution plans in a hierarchical manner that enables audiences to grasp the complete structure at a glance.
-
How to Use
Enter the main strategy name in the central box and populate the five nodes with detailed points such as team assignments, timelines, deliverables, outcomes, or risk factors. Colors and icons can be customized to match each point's characteristics. Insert into presentation slides, strategic plans, or reports within the strategy section.
-
Recommended For
Executives, planning teams, marketing departments, and project leaders sharing business strategies, organizational goals, and core messages. Effective for investor presentations, management meetings, strategic planning sessions, organizational restructuring announcements, and quarterly objective communications.
-
Slide Structure
Two-slide composition. First slide features a light background with a coral-pink central box and five dark navy and turquoise circular nodes arranged radially, each containing icons for documents, teams, schedules, outcomes, and risks. Second slide presents a dark background version with the same structure using a turquoise central box and white and dark navy nodes.
Related Products
-

Introducing Differentiated Product Services – Infographic Slide to Enhance Business Efficiency
#Product/Service Introduction #Diagram #Product/Service Introduction
-

Typographic Wide Template Flow Diagram1 – Business Operational Strategy
#Operational Plan #Technical Approach #Diagram
-

Income Statement Results Table - Visualizing Financial Performance
#Financial Plans and Performance #Diagram #Income Statement
-

Overview of Children's Learning Areas – Visualizing Diverse Learning Domains
#Product/Service Introduction #Diagram #Features
