Red Orange Table Chart – Optimized Diagram for Business Management
RJ0600082_21
- Last Update 07/12/2025
- File Size 1.7MB
- # of Slides 2
- File Format PPTX
- Slide Ratio 16:9
- Color
Keywords
- #Content-Based Slides
- #Design-Based Slides
- #Product/Service Introduction
- #Business Management
- #Diagram
- #Features
- #Execution Plan
- #Table
- #16:9
- #comparison analysis table PowerPoint
- #table chart slide design
- #5-column comparison table
- #business management table PPT
- #how to create a comparison table in PowerPoint
About the Product
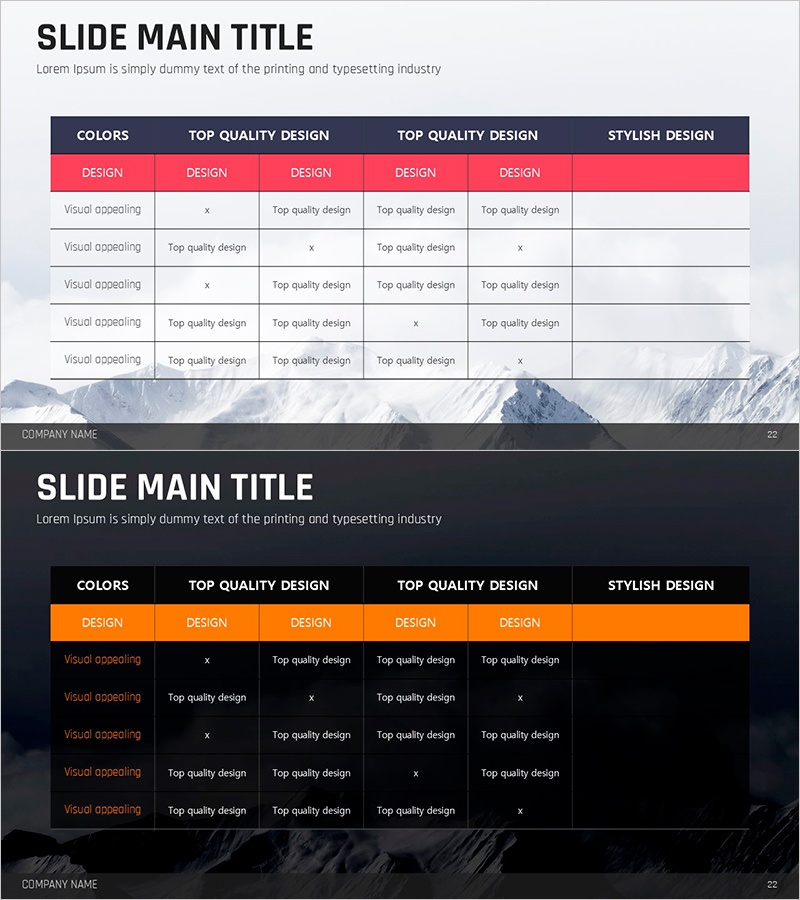
A comparison analysis table PowerPoint slide optimized for business management and product presentations. The red-orange header contrasts sharply with the white background, maximizing data readability. The 5-column table structure is ideal for comparing multiple items simultaneously, combining checkmarks and text to present both qualitative and quantitative information. Provided as a 2-slide set with light and dark background versions to suit various presentation contexts. Fully editable in PPTX format for immediate use.
Usage Points
-
Main Usage
Visualize side-by-side comparisons of products, services, or strategies, and display business management progress by category. The red-orange header emphasizes key information, while the combination of checkmarks and text enables simultaneous presentation of qualitative assessments and quantitative data.
-
How to Use
Fill each table cell with product names, features, pricing, ratings, or other comparative data for competitive analysis or product comparison matrices. Use the light background slide for standard presentations and the dark background for sophisticated, high-impact presentations. Colors and text are fully customizable.
-
Recommended For
Ideal for product introductions, marketing plans, business proposals, and management reports requiring comparative analysis. Effective for sales teams, marketing departments, and executive presentations supporting decision-making processes.
-
Slide Structure
2-slide set. Each slide features a 5-column header row (COLORS, TOP QUALITY DESIGN, TOP QUALITY DESIGN, STYLISH DESIGN, and additional column) with 5 data rows below. The first slide uses a light gray background; the second employs a dark navy background for visual variety and presentation flexibility.
Related Products
-

Monthly Sales Plan Schedule - Business and Success
#Business Strategy #Business Management #Diagram
-

Visualizing Business Strategy Activity Plan
#Business Strategy #Business Management #Diagram
-

High Calorie Food Ingredient Table – Visually Representing Foods
#Product/Service Introduction #Diagram #Features
-

This Month's Activity Plan Summary – Efficient Business Management
#Business Strategy #Business Management #Diagram
