Biological Silhouette According to Depth – A Unique Design for Understanding Marine Ecosystems
RJ0600081_10
- Last Update 07/12/2025
- File Size 0.4MB
- # of Slides 2
- File Format PPTX
- Slide Ratio 16:9
- Color
Keywords
About the Product
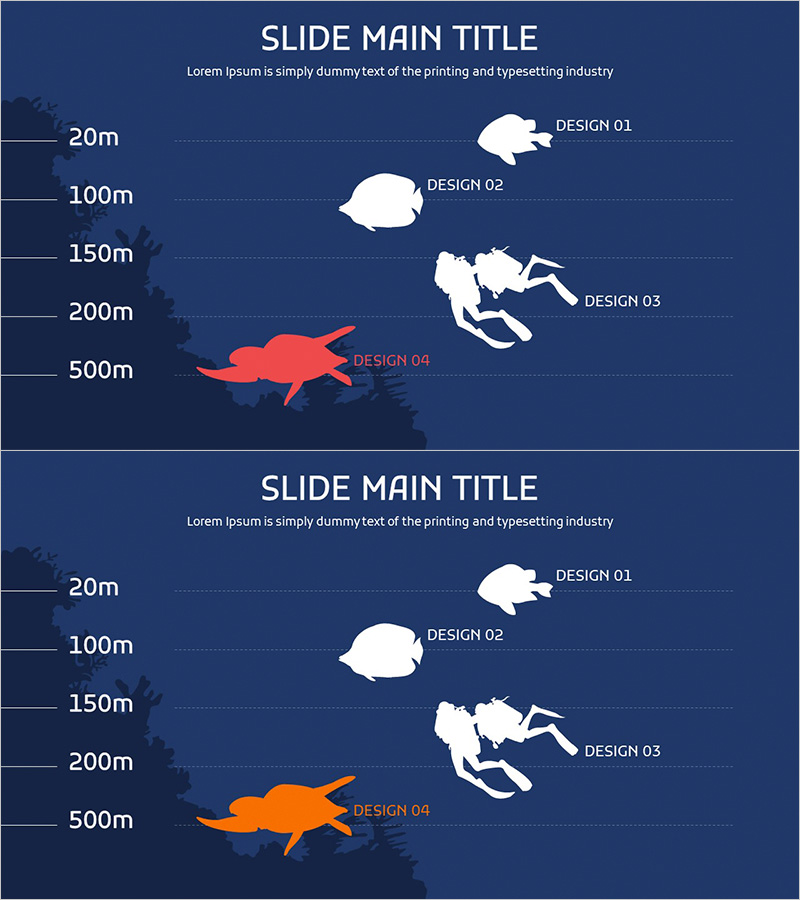
A PowerPoint slide visualizing marine organism distribution across five ocean depth levels, from 20m to 500m. Set against a dark blue background with white and orange silhouettes, this 2-slide deck uses a horizontal timeline format to display depth-specific species. The left-side depth scale and right-side organism icons create a clear information hierarchy, making it ideal for marine biology education, environmental presentations, and ecosystem analysis reports. Compatible with all presentation environments in 16:9 widescreen PPTX format.
Usage Points
-
Main Usage
This slide visualizes how marine species distribution changes across ocean depths, making it ideal for explaining marine ecosystems. The depth-based silhouette layout effectively communicates biodiversity patterns in environmental education, marine biology lectures, and ocean conservation project presentations.
-
How to Use
Use the depth scale (20m–500m) and organism icons to explain species distribution by depth zone. Add species names and characteristics as text labels, or highlight specific organisms with color emphasis. Insert into marine biology courses, environmental seminars, and biodiversity reports to enhance audience understanding of ocean ecosystems.
-
Recommended For
Marine biologists, environmental educators, ecology researchers, ocean conservation professionals, university instructors, and environmental policy makers. Suitable for K-12 science education, university marine science courses, environmental NGO presentations, marine resource management reports, and biodiversity awareness campaigns.
-
Slide Structure
Two-slide deck with identical layout: left-side depth scale (20m, 100m, 150m, 200m, 500m) and right-side organism silhouettes. Slide 1 features four white-colored organisms; Slide 2 highlights one orange-colored organism for emphasis. This color variation supports comparative presentations and step-by-step explanations of depth-based species changes.
Related Products
-

Running Face Measurement Table – Visualizing Fitness Data
#Product/Service Introduction #Financial Plans and Performance #Diagram
-

Human Silhouette and School Stickers PowerPoint Template – Education and Creativity
#Product/Service Introduction #Diagram #Other
-

Visual Infographic Slide on Tobacco Characteristics
#Product/Service Introduction #Diagram #Other
-

Suit Jacket Silhouette Slides – Highlighting Style and Appeal
#Product/Service Introduction #Other #Product/Service Introduction
