Budget & Schedule Management Strategy Slide – Data-Driven Planning
RJ0900035_6
- Last Update 09/10/2025
- File Size 24.4MB
- # of Slides 2
- File Format PPTX
- Slide Ratio 16:9
- Color
Keywords
- #Content-Based Slides
- #Design-Based Slides
- #Financial Plans and Performance
- #Diagram
- #Graph
- #Capital Requirements
- #Budget
- #Table
- #Column
- #Standard Table
- #Column Chart
- #16:9
- #budget management PowerPoint
- #project schedule slide template
- #horizontal bar chart PPT
- #cost allocation diagram
- #financial performance table slide
About the Product
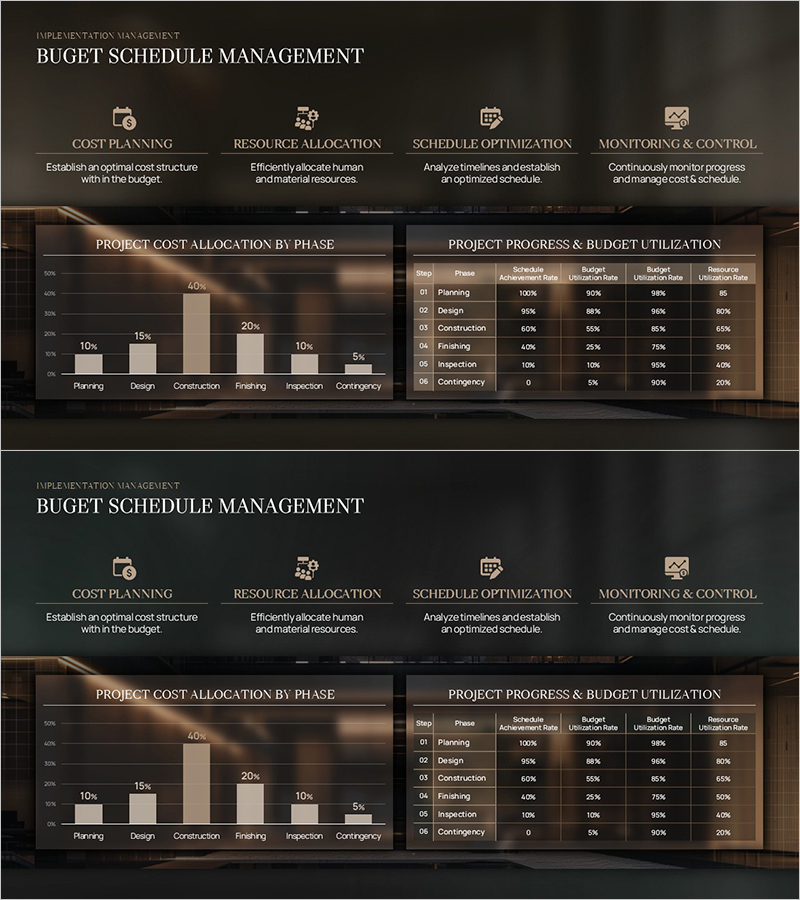
A 2-slide PowerPoint presentation for project budget and schedule management. The first slide visualizes cost allocation across six project phases (Planning, Design, Construction, Finishing, Inspection, Contingency) using a horizontal bar chart. The second slide presents a data table tracking schedule achievement rate, budget utilization rate, and resource allocation rate for each phase. The warm brown background with beige and gray data areas creates a professional look suitable for financial reports and project status presentations. Delivered in 16:9 widescreen PPTX format, fully editable to accommodate your actual project figures and metrics.
Usage Points
-
Main Usage
Simultaneously present project budget distribution and phase-by-phase progress status to stakeholders and team members. The bar chart excels at comparing cost magnitudes across phases, while the data table provides quantitative tracking of achievement rates and resource utilization.
-
How to Use
Input actual project phase budgets into the first slide's bar chart, then update the second slide's table with current progress rates, budget achievement percentages, schedule achievement rates, and resource utilization figures. Use during monthly or quarterly project review meetings, executive briefings, and investor presentations.
-
Recommended For
Project managers, construction companies, engineering firms, manufacturers, and consulting firms conducting project status reports and budget reviews. Ideal for financial team presentations, executive reviews, and client-facing periodic status updates.
-
Slide Structure
Slide 1: Horizontal bar chart displaying 6 project phases with percentage allocations (Planning 10%, Design 15%, Construction 40%, Finishing 20%, Inspection 10%, Contingency 5%). Slide 2: Data table with 6 rows (phases) and 5 columns (Phase, Progress Rate, Budget Achievement Rate, Schedule Achievement Rate, Resource Utilization Rate). All numerical values are editable text fields.
Related Products
-

Interior Cost Plan PowerPoint – Budget Table Dark
#Financial Plans and Performance #Diagram #Capital Requirements
-

Blue Line Wide Template Table2 – Stylish Design for Financial Planning
#Financial Plans and Performance #Diagram #Capital Requirements
-

Table Chart and Arrow Signs
#Financial Plans and Performance #Diagram #Capital Requirements
-

Create a Travel Budget – Strategic Planning
#Financial Plans and Performance #Diagram #Capital Requirements
