Sea Lighthouse Risk Management Cycle Diagram
RJ0600079_25
- Last Update 07/11/2025
- File Size 2.7MB
- # of Slides 2
- File Format PPTX
- Slide Ratio 16:9
- Color
Keywords
About the Product
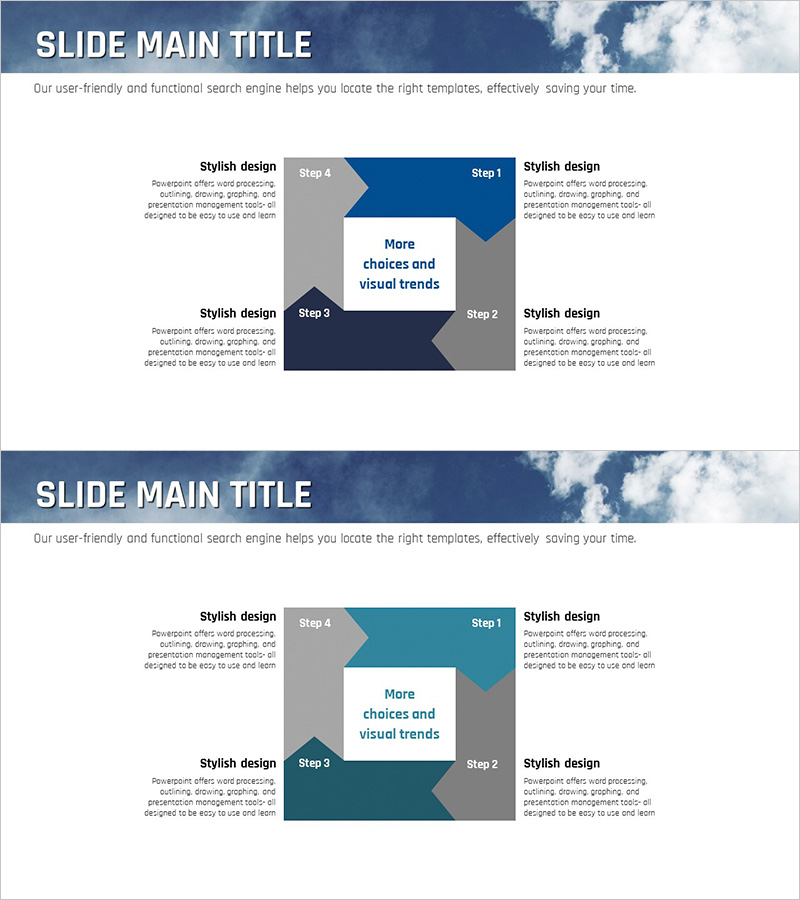
A PowerPoint slide that visualizes the risk management process through a 4-step circular flow diagram. Color-coded arrow-shaped nodes represent each stage—identify, assess, respond, and monitor—creating a clear representation of the continuous risk management cycle. Detailed explanation areas surround each step, enabling effective communication of key content during presentations. Composed of 2 slides in 16:9 widescreen format, this diagram is ready to use in executive risk management reports, audit presentations, compliance briefings, and strategic planning sessions.
Usage Points
-
Main Usage
Clearly visualizes the iterative risk management process through a 4-step circular structure, effectively communicating the organization's cycle of risk identification, assessment, response, and monitoring. Emphasizes the continuous and cyclical nature of risk management in executive briefings, audit reports, and strategic planning presentations.
-
How to Use
Enter risk management activities for each step (Step 1–4) in the arrow-shaped areas, and add detailed descriptions, responsible parties, and timelines in the surrounding text boxes. Use color differentiation to visually represent progress across stages, and place key messages or organizational slogans in the central area to focus audience attention.
-
Recommended For
Risk managers, audit professionals, executives, project managers, and quality assurance teams explaining risk management policies, processes, and performance. Suitable for corporate risk management reports, internal audit presentations, executive briefings, and management system documentation (ISO 27001, ISO 9001, etc.).
-
Slide Structure
Composed of 2 slides with a central 4-step circular diagram (4 arrow-shaped nodes) and 4 text box areas positioned at top, bottom, left, and right. The first slide features navy and dark blue tones; the second uses teal and cyan variations for adaptability to different presentation contexts. Optimized for 16:9 widescreen format, compatible with modern projectors and digital displays.
Related Products
-

Key Events Roadmap – Business Strategy and Diagram Utilization
#Business Strategy #Business Management #Diagram
-

Step-by-step Business Objectives Diagram – Execution Roadmap for Vision Realization
#Product/Service Introduction #Business Vision and Strategy #Diagram
-

Graph of User Status Analysis by Age Group
#Market and Competitor Analysis #Diagram #Graph
-

Internet Security Platform Structure Diagram – Stability and Innovation
#Business Strategy #Technical Approach #Diagram
