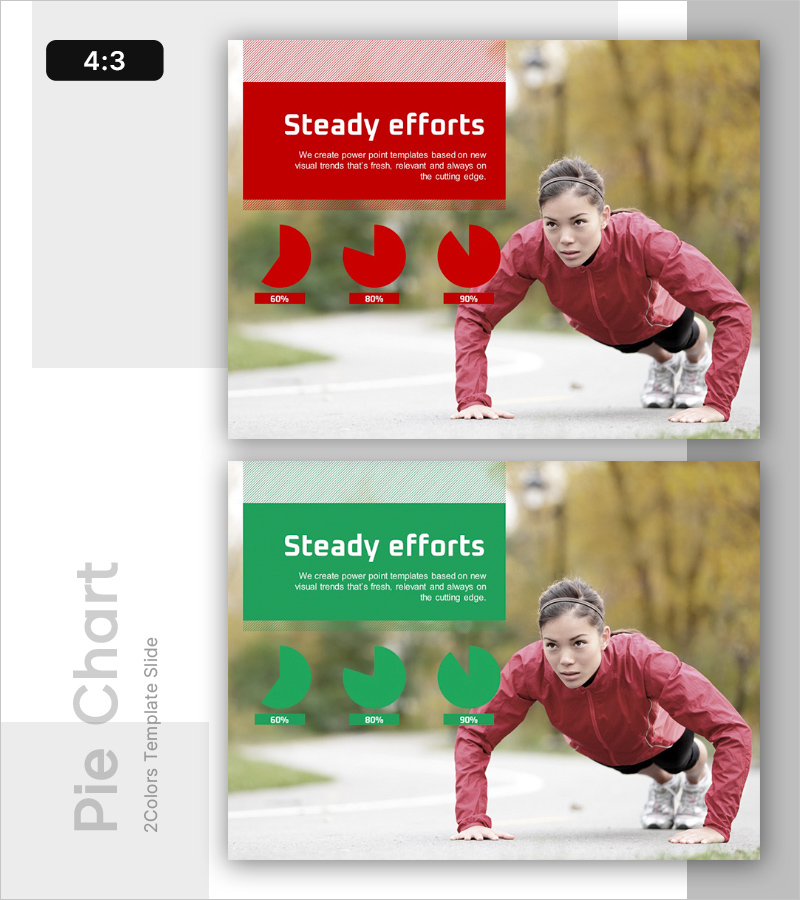
Pie Chart Slide for Market Share Analysis – Steady Efforts
RL0100029_3
- Last Update 01/20/2025
- File Size 1.7MB
- # of Slides 2
- File Format PPTX
- Slide Ratio 4:3
- Color
Keywords
About the Product
A pie chart PowerPoint slide designed to visualize market share analysis and growth trends. Available in two color versions—red and green—each slide displays three progression stages (60%, 80%, 90%) using circular charts. The layout clearly separates text and chart areas, allowing simultaneous presentation of title, description, and numerical data. Combined with background imagery for visual impact, this 4:3 ratio PPTX file is ready for immediate editing and customization.
Usage Points
-
Main Usage
Communicate ratio-based data such as market analysis, sales performance, and growth trends through intuitive pie charts. Visualize three progression stages (60%, 80%, 90%) to clearly express step-by-step achievements or goal completion rates.
-
How to Use
Enter your analysis topic (e.g., market share, sales growth rate) in the title area and provide analytical context in the description field. Input numerical values below each pie chart to display stage-by-stage data. Background imagery can be retained or replaced as needed.
-
Recommended For
Ideal for marketing plans, business reports, investor presentations, and quarterly performance reviews in the market analysis section. Suitable for sales teams, marketing departments, and executive briefings, particularly effective for presentations emphasizing growth trajectories.
-
Slide Structure
Title text box positioned in upper left, description text box in upper right, and three pie charts arranged horizontally at the bottom. Each chart includes a percentage input area below, creating a clear data hierarchy.
Related Products
-

Cluster Slide for Company Overview - See the Possibilities
#Emotional Messages
-

Knowhow Template Cover – Delivering Expertise and Trust
#Emotional Messages
-

Business Growth Analysis Graph – Market Outlook and Growth Potential
#Emotional Messages
-

Growth and Development – Effective Business Strategy Introduction
#Emotional Messages
