Market Analysis with Donut Graph – The Power of Data Visualization
RL0100068_3
- Last Update 01/22/2025
- File Size 1.9MB
- # of Slides 2
- File Format PPTX
- Slide Ratio 4:3
- Color
Keywords
About the Product
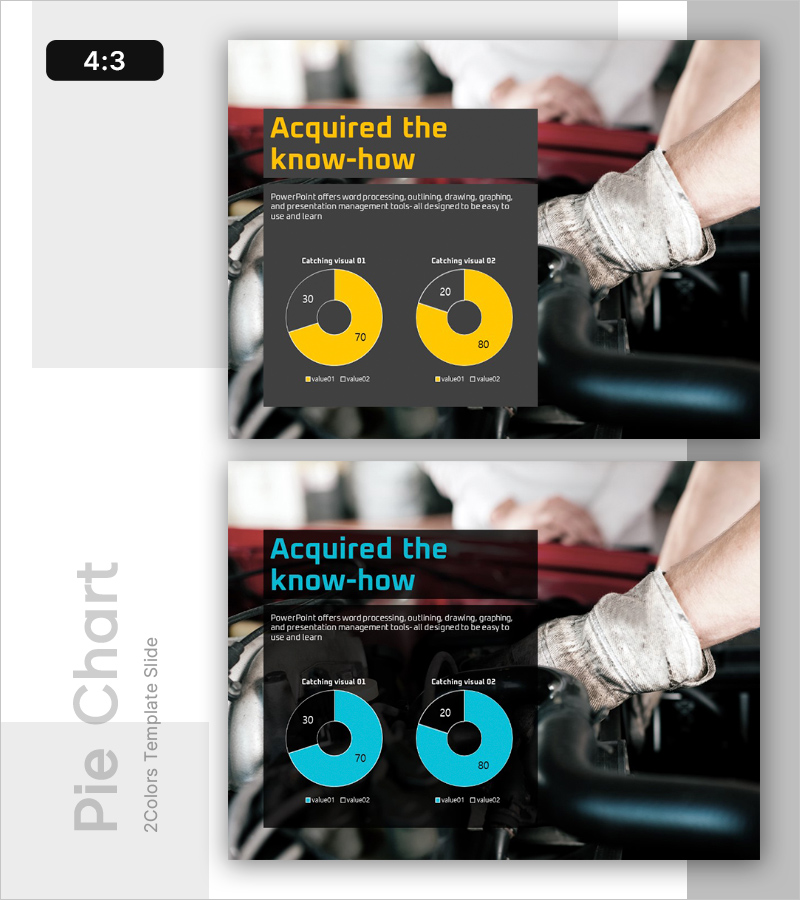
A data visualization PowerPoint slide designed for growth and breakthrough presentations. This slide features two donut-shaped charts in yellow and blue colors, enabling intuitive comparison of categorical data and numerical values. The bright chart colors contrast sharply against the dark background, creating strong visual emphasis for presentations. The layout includes a title section at the top, two donut charts in the center with clear data labels, and a legend with descriptive text at the bottom. This presentation template is ready to use for market analysis, performance comparison, category analysis, and various business scenarios.
Usage Points
-
Main Usage
This data visualization slide uses donut charts to simultaneously display categorical ratios and numerical values. Two side-by-side charts enable comparison of different datasets, while the high-contrast dark background design maximizes visual impact in presentation environments.
-
How to Use
Apply this slide when presenting ratio-based data such as market analysis, performance comparison, customer segmentation, or product category breakdown. Edit the chart values and legend with your own data for immediate use, and add your slide title in the title section to complete the presentation.
-
Recommended For
Recommended for marketing professionals, executives, analysts, and consultants who support data-driven decision-making. Ideal for business reports, market analysis documents, performance presentations, and strategic planning meetings where numerical comparisons must be clearly communicated.
-
Slide Structure
The slide set consists of 2 slides in 4:3 aspect ratio. Layout includes a title section with yellow background at the top, two independent donut charts in the center (displaying 30/70 and 20/80 ratio examples), and legend with descriptive text at the bottom. Each chart is independently editable with fully customizable data values.
Related Products
-

Segmented Bar Graph – Market and Competitor Analysis
#Emotional Messages
-

Business Vision Template Focused on Achievements – The Fruit of One's Efforts
#Emotional Messages
-

Potential Template Cover – A Professional and Emotional Start
#Emotional Messages
-

Cluster Slide for Company Overview - See the Possibilities
#Emotional Messages
