Segmented Bar Graph – Market and Competitor Analysis
RL0100030_3
- Last Update 10/20/2025
- File Size 0.9MB
- # of Slides 2
- File Format PPTX
- Slide Ratio 4:3
- Color
Keywords
About the Product
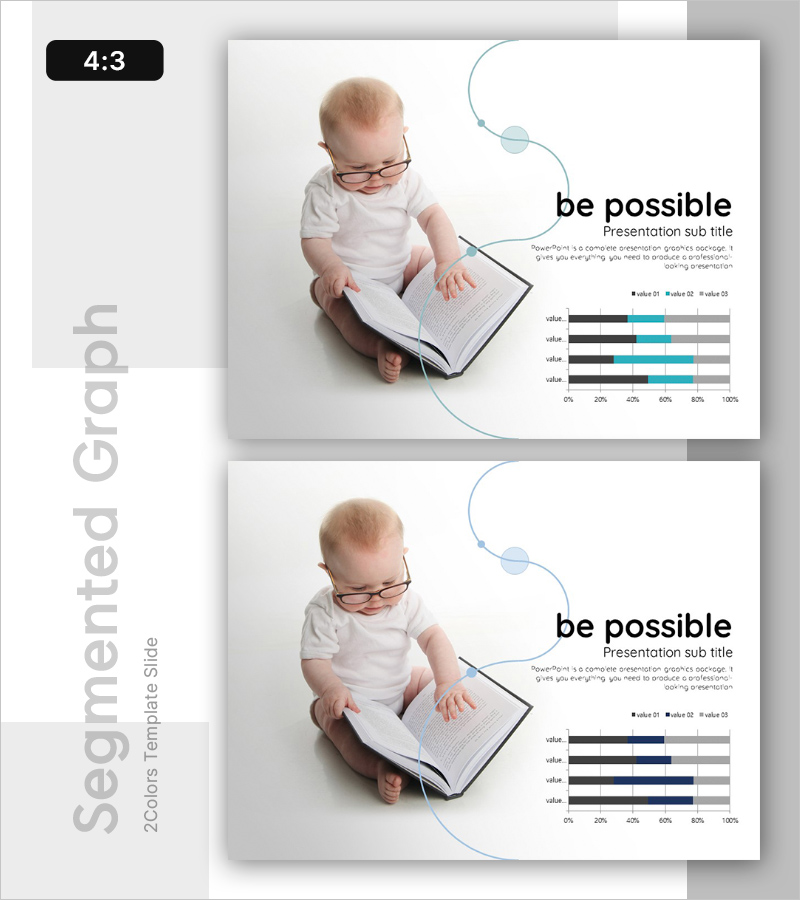
A segmented horizontal bar chart PowerPoint slide designed for market and competitor analysis presentations. This template visualizes 4 data items across 3 categories using a black, blue, and gray color palette that enhances data readability. The 2-slide set includes two color variations—a blue-accent version for emphasis and a neutral gray-tone version for objective analysis. Ideal for comparing market share, competitor performance, customer satisfaction, and other multi-metric benchmarks in business reports and investor pitches.
Usage Points
-
Main Usage
This slide enables simultaneous comparison of multiple metrics such as market share, competitor performance, and customer satisfaction scores. The segmented bar structure presents 3 data categories for each of 4 items in a horizontal layout, making relative size comparison and ranking intuitive at a glance. Supports data-driven decision-making in executive briefings, investor presentations, and strategic planning meetings.
-
How to Use
Replace the 4 item labels (value 01–04) and 3 category data points with your analysis results. Use the blue-accent version to highlight a specific category or key finding, and the gray-tone version for neutral, objective reporting. Insert into market analysis, competitive positioning, or performance evaluation sections to strengthen presentation credibility.
-
Recommended For
Marketing, strategy, and sales professionals presenting market conditions and competitive positioning. Effective in business plans, investor pitch decks, quarterly performance reports, and executive dashboards. Widely used in consulting, research, and financial services presentations requiring data-driven analysis visualization.
-
Slide Structure
The slide uses a 2-column layout with an image area on the left and text/chart area on the right. The right side contains a title (be possible), subtitle (Presentation sub title), one line of descriptive text, and a 4-row segmented horizontal bar chart. Each bar is divided into 3 color segments representing the comparison structure clearly.


