Coffee Bean Infographic - Capturing Visual Appeal
RJ0600075_8
- Last Update 07/10/2025
- File Size 3.3MB
- # of Slides 2
- File Format PPTX
- Slide Ratio 16:9
- Color
Keywords
About the Product
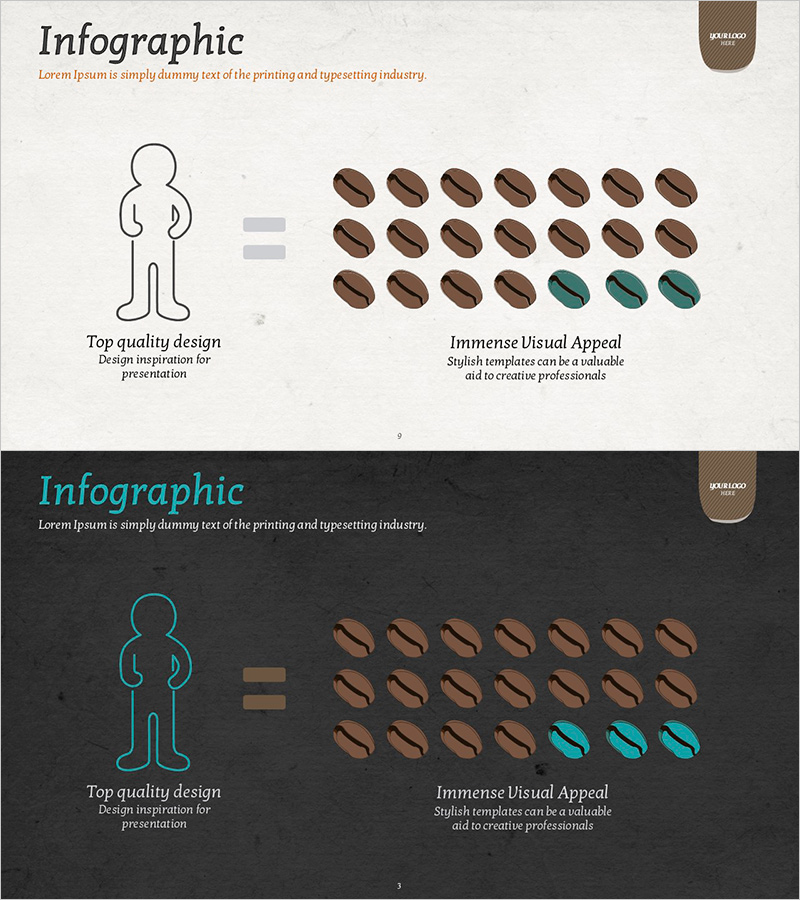
A data visualization PowerPoint slide using coffee bean counts to represent comparative metrics. Available in two color schemes: light beige background and dark charcoal background, featuring a linear human figure icon and brown and teal circular coffee bean elements arranged in a comparison grid layout. Ideal for market analysis, customer segmentation, and statistical presentations, this infographic slide transforms quantitative data into intuitive visual storytelling. The balanced arrangement of text descriptions and visual elements makes it ready for immediate use in the analysis section of business presentations.
Usage Points
-
Main Usage
Transform quantitative metrics and ratio data into intuitive visual representations using coffee bean count infographics. Effectively communicate market share, customer satisfaction scores, product preference rates, and comparative analysis data at a glance.
-
How to Use
Select the light beige background version for bright-toned presentations or the dark charcoal version for premium-styled presentations. Edit the coffee bean count and colors to match your actual data, then input your analysis content into the text areas.
-
Recommended For
Marketing analytics, market research reports, customer segmentation analysis, product comparison presentations, and business insight sharing. Particularly effective for executive briefings and investor pitches where data credibility and visual clarity are essential.
-
Slide Structure
Two-slide set with each slide featuring a three-column layout: linear human figure icon on the left, equals symbol in the center, and coffee bean grid on the right. Beans are arranged in a 3-row by 7-column grid with select beans highlighted in teal to visually distinguish comparison categories.
Related Products
-

Business Partner Customer Reviews – Simple and Stylish Design
#Market and Competitor Analysis #Customer Success Stories #Diagram
-

Visualizing Customer Analysis with Silhouette and Gauge Chart
#Market and Competitor Analysis #Graph #Other
-

Geometry PPT Template Wide Silhouette and Information – Optimized for Market Analysis
#Market and Competitor Analysis #Customer Success Stories #Other
-

Modern Business Presentation Template Arrow Diagram
#Market and Competitor Analysis #Diagram #Other
