Silhouette Graph & Overlay Diagram – Market Analysis and Customer Insights
RJ0400033_15
- Last Update 05/26/2025
- File Size 2.9MB
- # of Slides 2
- File Format PPTX
- Slide Ratio 16:9
- Color
Keywords
- #Content-Based Slides
- #Design-Based Slides
- #Market and Competitor Analysis
- #Diagram
- #Other
- #Customer Analysis
- #Cluster
- #Combination Diagram
- #Silhouette
- #16:9
- #silhouette graph PowerPoint
- #overlay diagram slide template
- #market analysis chart
- #customer demographics visualization
- #visual trends PPT slide
About the Product
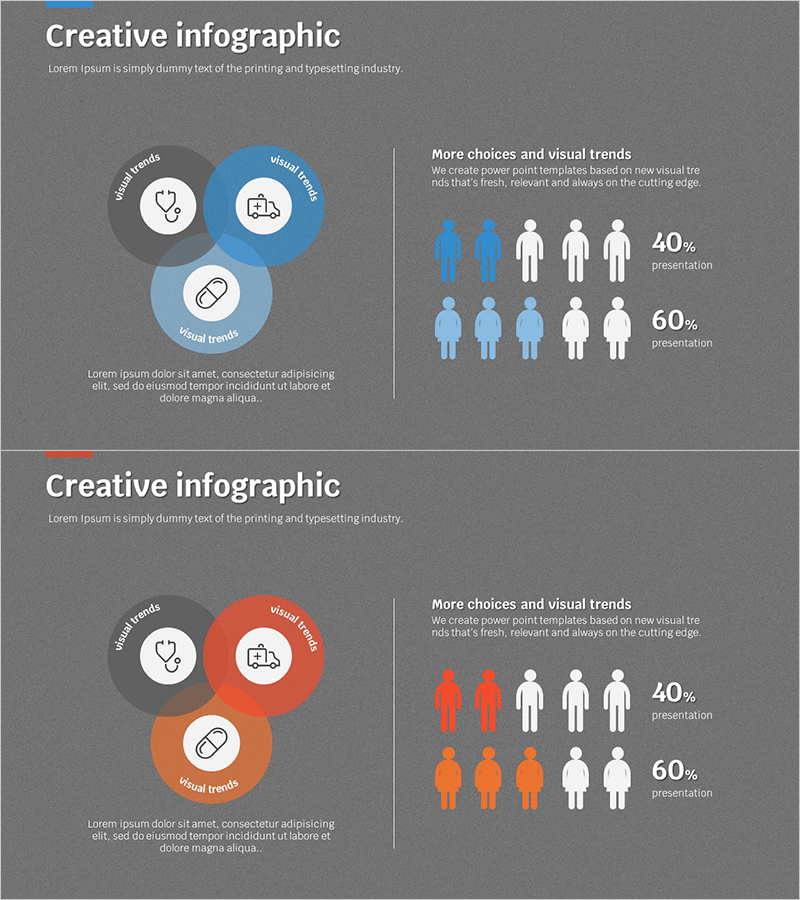
A 2-slide PowerPoint presentation template for visualizing market analysis and customer insights. The left overlay diagram uses three circular nodes to represent trend intersections, while the right silhouette graph displays demographic ratios through icon-based visualization. Dark gray background with blue and orange accent colors maximizes data contrast and visual hierarchy. Delivered in 16:9 widescreen PPTX format, fully editable and ready to customize. Ideal for marketing strategy presentations, business reports, and customer segmentation analysis slides.
Usage Points
-
Main Usage
A data visualization slide that compares market segmentation and customer demographics at a glance. The left overlay diagram with three circular nodes emphasizes trend intersections, while the right silhouette icon graph intuitively represents gender ratio composition. Optimized for marketing strategy, customer analysis, and market research presentations.
-
How to Use
Insert demographic data into the market analysis section of marketing strategy decks, or use in business reports' market overview pages for competitive analysis. Customize blue and orange colors to match your company brand palette for cohesive presentation materials.
-
Recommended For
Marketing managers, business planning teams, market research analysts, and sales strategy professionals presenting customer segmentation and market positioning. Suitable for startup investor pitch decks, quarterly business reviews, and new product launch strategy presentations.
-
Slide Structure
Slide 1: Three overlapping circular nodes (Social Trends, Visual Trends, Visual Trends) with descriptive text below. Slide 2: Left side features 5 male and 5 female silhouette icons (40% blue, 60% orange highlight) with text area on right. 16:9 widescreen format with dark gray background and white typography.
Related Products
-

Infographic in a Woman's Head – Data Analytics and Customer Insight
#Product/Service Introduction #Market and Competitor Analysis #Diagram
-

Office Worker Briefcase Silhouette Diagram – Intuitive Customer Analysis
#Product/Service Introduction #Market and Competitor Analysis #Diagram
-

Businessperson Ability Assessment Slide – Visualizing Expertise Levels
#Company Introduction #Market and Competitor Analysis #Diagram
-

Social Platform Use Case Slide
#Slide Type #Market and Competitor Analysis #Diagram
