Sustainability Pie Chart for Animal Nature Conservation Program – Emphasizing Social Responsibility
RJ0600074_9
- Last Update 07/10/2025
- File Size 3.2MB
- # of Slides 2
- File Format PPTX
- Slide Ratio 16:9
- Color
Keywords
- #Content-Based Slides
- #Design-Based Slides
- #Market and Competitor Analysis
- #Corporate Social Responsibility
- #Graph
- #Market Share
- #Sustainability Programs
- #Circles
- #Pie Chart
- #16:9
- #pie chart PowerPoint slide
- #circular graph template
- #data ratio visualization
- #sustainability presentation
- #environmental report slide
- #nature conservation chart
- #pie chart download
About the Product
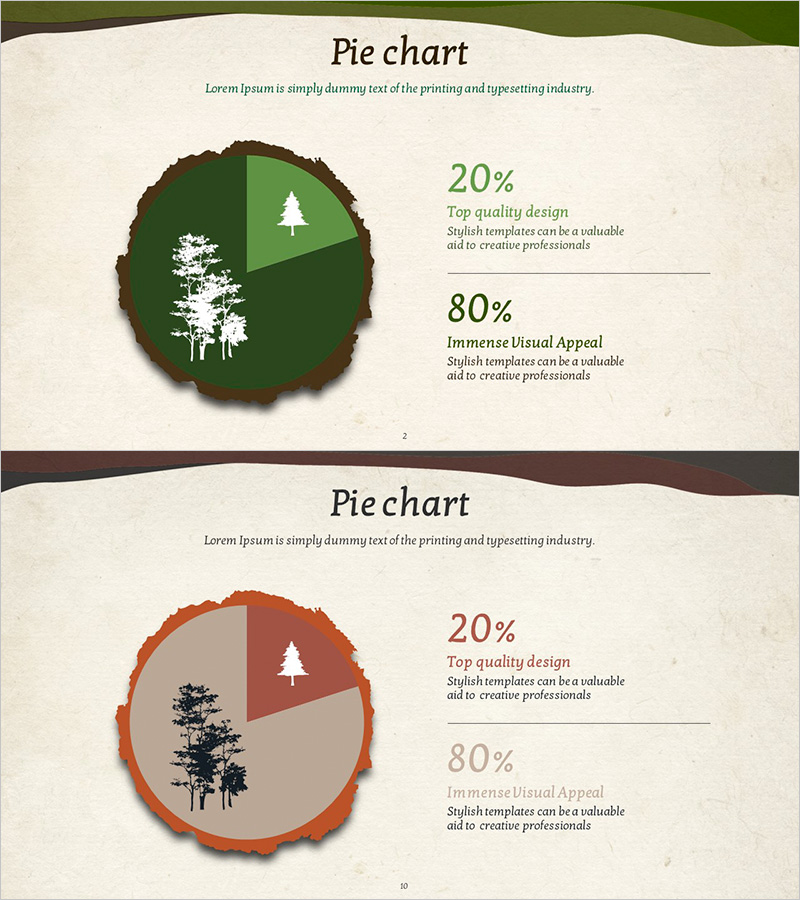
A 2-slide pie chart PowerPoint template emphasizing sustainability and environmental social responsibility. This presentation slide features circular data visualization with nature-themed silhouettes of trees and animals, rendered in green and orange color schemes to reinforce ecological messaging. Optimized for 16:9 widescreen format in PPTX, each slide displays ratio data (20% and 80%) alongside descriptive text areas for detailed explanation. Perfect for environmental reports, corporate social responsibility presentations, nature conservation program pitches, and sustainability initiatives requiring clear data representation.
Usage Points
-
Main Usage
Clearly visualize ratio data for environmental sustainability, corporate social responsibility, and nature conservation initiatives using circular pie charts. Emphasize key percentages (such as 20% and 80%) to strengthen core messaging, while integrated ecological icons enhance presentation credibility and thematic consistency throughout the deck.
-
How to Use
Deploy in environmental reports, sustainability presentations, and corporate social responsibility (CSR) initiatives to illustrate data comparisons and proportional relationships. Input specific metrics and explanations into designated text areas to boost audience comprehension. The 16:9 widescreen optimization ensures compatibility with modern presentation environments and professional display standards.
-
Recommended For
Environmental professionals, sustainability planning teams, corporate social responsibility departments, nonprofit organizations, government agencies, and educational institutions presenting ecology-related topics. Ideal for animal protection initiatives, forest conservation, renewable energy projects, carbon reduction strategies, and any nature-focused program requiring visual data communication.
-
Slide Structure
Two-slide composition with each slide featuring a 2-segment pie chart centered on the layout, accompanied by percentage values (20%, 80%) and explanatory text fields on the right. First slide uses green color palette; second employs orange tones for visual variety. Tree and animal silhouettes are integrated within the chart segments, maintaining visual coherence with the ecological theme throughout.
Related Products
-

Pie Chart about War – Visualizing Information
#Product/Service Introduction #Market and Competitor Analysis #Graph
-

Triangular Pattern Presentation Template Pie Chart – Market Analysis and Strategy
#Market and Competitor Analysis #Financial Plans and Performance #Diagram
-

Market Share Pie Chart – Visual Data Analysis
#Market and Competitor Analysis #Graph #Market Share
-

Pie Chart for Oriental Medicines Market Overview
#Market and Competitor Analysis #Graph #Market Status
