Animal Nature Conservation Program Goal Market Strategy Chart
RJ0600074_30
- Last Update 07/10/2025
- File Size 3MB
- # of Slides 2
- File Format PPTX
- Slide Ratio 16:9
- Color
Keywords
- #Content-Based Slides
- #Design-Based Slides
- #Business Strategy
- #Marketing Plan and Strategy
- #Graph
- #Implementation Framework
- #Target Market Strategy
- #Horizontal Bar
- #Segmented Horizontal Bar
- #16:9
- #100% stacked column chart PowerPoint
- #stacked bar chart template
- #ratio visualization slide
- #market strategy chart
- #data proportion PPT
- #PowerPoint graph slide template
About the Product
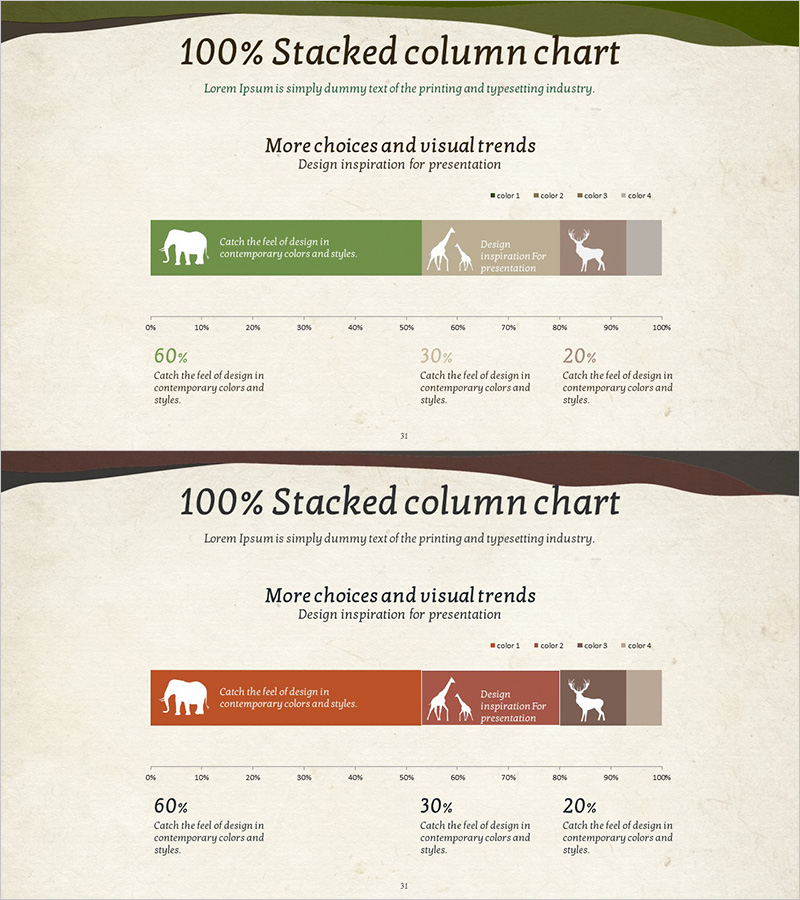
A 100% stacked horizontal bar chart PowerPoint slide designed to visualize conservation program goals and market strategy distribution. The chart uses four color segments—green, orange, gray, and beige—to represent proportional data with clear visual hierarchy. Animal silhouette icons paired with text areas enhance information clarity, while 0%-100% scale markings and explicit percentage labels (60%, 30%, 20%) facilitate data interpretation. This presentation template is ideal for displaying resource allocation, market segment distribution, conservation priority rankings, and strategic goal breakdowns in business reports and investor pitches.
Usage Points
-
Main Usage
Clearly compare and visualize proportional relationships between data segments. The 100% stacked structure simultaneously displays cumulative totals and individual segment percentages, making it ideal for resource allocation analysis, market segment distribution, conservation program prioritization, and strategic goal breakdown presentations.
-
How to Use
Input actual data values into the four color-coded segments to adjust proportions automatically. Update category labels and descriptions in the text boxes adjacent to animal silhouette icons, then modify percentage figures to match your data. Ready for immediate use in marketing presentations, business reports, and strategy meetings.
-
Recommended For
Marketing professionals, strategy planners, environmental organizations, NGOs, and consulting firms. Recommended for presenting market segment analysis, resource allocation status, business priorities, customer segmentation ratios, and conservation goal distribution. Enhances credibility in executive briefings, investor presentations, and strategic planning sessions.
-
Slide Structure
2-slide set. Slide 1: 100% stacked horizontal bar chart in green, orange, gray, and beige + 3 animal silhouette icons + text annotation areas. Slide 2: Identical chart structure with orange, brown, and gray color variation + explicit 60%, 30%, 20% percentage labels + descriptive text. 16:9 widescreen format, fully editable PPTX file.
Related Products
-

Target Market Analysis Bar Graph – Visualizing Market Strategies
#Market and Competitor Analysis #Marketing Plan and Strategy #Graph
-

Curved Theme Purple Template Diagram
#Business Strategy #Marketing Plan and Strategy #Diagram
-

US Target Market Analysis Graph – Understanding Market Segmentation
#Market and Competitor Analysis #Marketing Plan and Strategy #Graph
-

Slide Highlighting Four Core Values – Business Strategy
#Business Strategy #Marketing Plan and Strategy #Diagram
