Farming Harvest Business History Connection Diagram
RJ0600073_4
- Last Update 07/09/2025
- File Size 4.1MB
- # of Slides 2
- File Format PPTX
- Slide Ratio 16:9
- Color
Keywords
About the Product
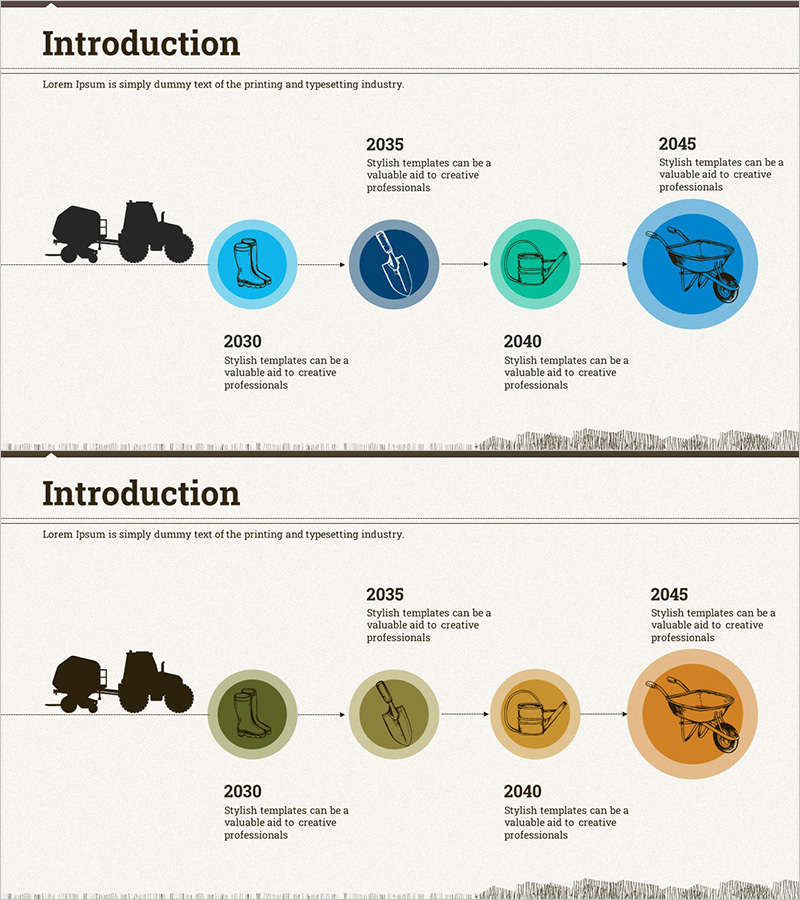
A 4-stage linear connection diagram PowerPoint slide that visualizes agricultural and harvest business evolution across time. Starting from a farm machinery silhouette on the left, the design flows rightward through arrow-connected circular nodes, each containing an icon (boot, tool, basket, cart) representing different business phases. Blue and green gradient circular nodes intuitively convey temporal progression and business development stages. The 2-slide set includes identical layouts in two color variations (blue tone and earth tone) for flexible use across multiple presentation sections. Fully editable PPTX format allows instant customization of text and colors.
Usage Points
-
Main Usage
Ideal for presenting business development phases, product evolution, technology innovation timelines, and organizational growth history in chronological order. Icons and color transitions clearly communicate progression, enhancing audience comprehension and engagement.
-
How to Use
Double-click circular nodes to edit stage names, years, and descriptions. Icons can be replaced via the Insert tab, and colors are adjustable through shape formatting options. The 2-slide set offers two color schemes—use different tones for section differentiation or maintain consistency with a single tone throughout your presentation.
-
Recommended For
Recommended for agricultural, food, and manufacturing companies presenting company history and business evolution. Ideal for startups explaining growth stages, product development processes, organizational transformation, and innovation strategies. Effective for executive, investor, and employee onboarding presentations.
-
Slide Structure
Both slides feature identical layout: left-side farm machinery silhouette → center 4 circular nodes (each with icon + text field) → arrow connections between nodes. Slide 1 uses blue tones (light blue, navy, mint); Slide 2 uses earth tones (green, beige, orange) for color variation.
Related Products
-

2D Company Employee Character Theme History – Vision and Growth
#Company Introduction #Technical Approach #Diagram
-

Green & Gray Template Wide History
#Company Introduction #Business Strategy #Diagram
-

History Text Diagram – Business Growth Story
#Company Introduction #Diagram #Text Box
-

Newspaper Wide PowerPoint Template History – Visualizing Business Strategy
#Company Introduction #Business Strategy #Diagram
