Blue Green Table Analysis Slide – Visual Appeal and Practicality
RJ0600069_30
- Last Update 07/08/2025
- File Size 5.1MB
- # of Slides 2
- File Format PPTX
- Slide Ratio 16:9
- Color
Keywords
About the Product
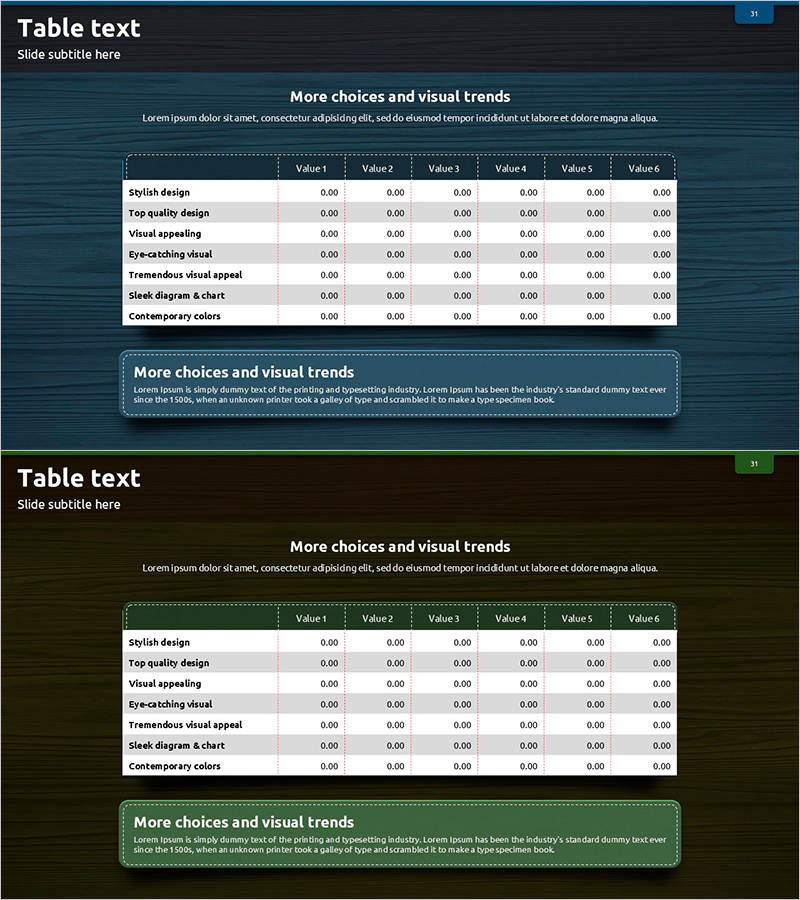
A data analysis table PowerPoint slide featuring 6 columns and 7 rows with a blue-green header design and white data cells for optimal readability. This presentation template is ideal for financial reports, market research summaries, product performance comparisons, and departmental KPI analysis. The 2-slide set includes a standard table layout and a variation with emphasis highlighting for key metrics. Fully editable in PPTX format with 16:9 widescreen aspect ratio, allowing you to customize colors, fonts, and data entries to match your brand identity and presentation needs.
Usage Points
-
Main Usage
Present quantitative data such as financial performance, market research findings, product metrics, and departmental KPIs in a structured and visually organized format. The blue-green header clearly separates the data area, establishing a strong visual hierarchy that guides audience attention to key information.
-
How to Use
Enter your data into the first slide's table cells, then use the second slide to highlight specific rows or columns that require emphasis. Customize cell background colors and text formatting to align with your corporate branding. Suitable for quarterly reports, analytical presentations, strategy meetings, and executive briefings.
-
Recommended For
Finance teams presenting quarterly earnings and budget analysis, marketing teams showcasing campaign performance metrics, sales teams comparing regional targets and achievements, and executives reviewing organizational KPIs. Ideal for any data-driven business presentation requiring clear numerical comparison.
-
Slide Structure
2-slide set. Slide 1: Standard 6-column (Value 1–6) × 7-row table with blue-green header row and white data cells. Slide 2: Identical table structure with optional color overlay for row or column emphasis. Both slides feature dotted border framing and 16:9 widescreen format for professional presentation delivery.
Related Products
-

Promotion Strategy Table – The Basis of Marketing Strategies
#Marketing Plan and Strategy #Diagram #Promotion Strategy
-

Triangle Pattern Template Table – Visualizing Business Strategy
#Business Vision and Strategy #Financial Plans and Performance #Diagram
-

Modern Blue Pie Chart Template – Market Share Analysis
#Market and Competitor Analysis #Diagram #Graph
-

Hologram Wide PPT Table & Segmentation Bar Graph – Trendy Data Visualization
#Market and Competitor Analysis #Financial Plans and Performance #Diagram
