Regional Illustration Infographic – Visualization of Target Market Strategy
RJ0600041_13
- Last Update 07/01/2025
- File Size 0.3MB
- # of Slides 2
- File Format PPTX
- Slide Ratio 16:9
- Color
Keywords
- #Content-Based Slides
- #Design-Based Slides
- #Company Introduction
- #Marketing Plan and Strategy
- #Other
- #Domestic Network
- #Target Market Strategy
- #Map
- #16:9
- #US map PowerPoint slide
- #regional market analysis presentation
- #infographic map slide
- #marketing regional strategy PPT
- #geographic data visualization slide
About the Product
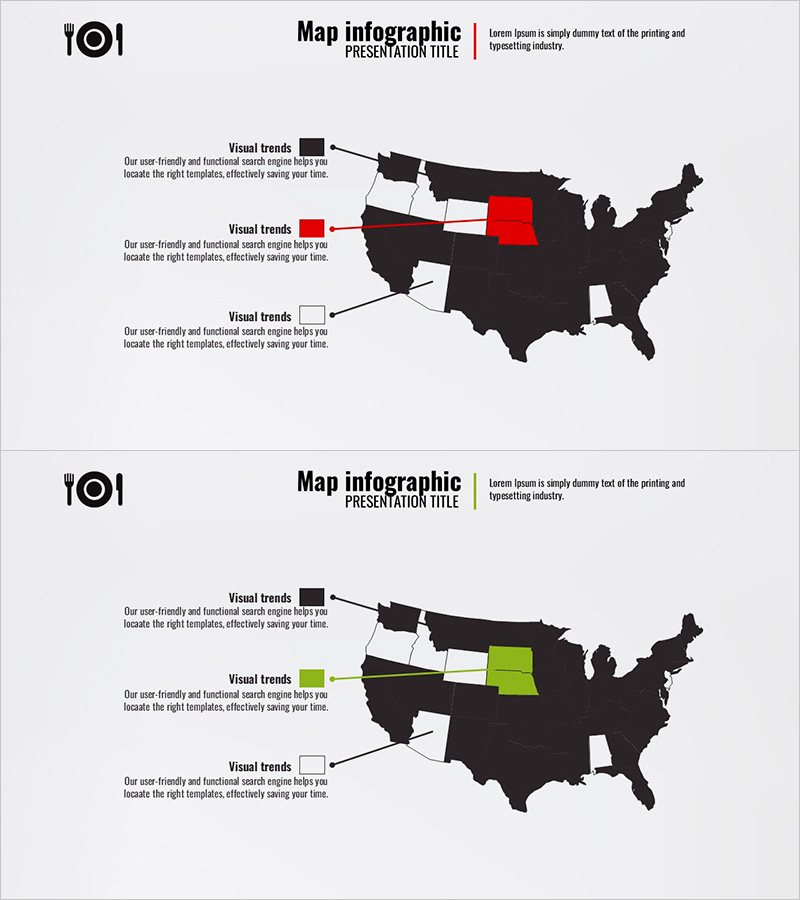
A 2-slide PowerPoint presentation that visualizes regional market data across the United States using color-coded geographic emphasis. The slides feature a dark background with red, green, and white highlighted regions, each paired with descriptive text boxes for clear communication of marketing strategies, market insights, and target customer segments. Optimized for 16:9 widescreen format, these slides are ready to use in company presentations, marketing plans, and business proposals where regional strategy visualization is essential.
Usage Points
-
Main Usage
Visualize regional market conditions, customer distribution, and sales strategies using geographic mapping to support strategic decision-making. The high-contrast dark background with red, green, and white emphasis regions draws audience attention and enables intuitive understanding of regional data differences.
-
How to Use
Use in marketing plans, business proposals, and market analysis presentations to explain regional target markets, competitive landscapes, and growth opportunities. Input region names, sales figures, customer counts, and strategic directions into each text box to create clear regional comparisons.
-
Recommended For
Marketing managers, sales strategy teams, and executives presenting regional expansion plans, market entry strategies, and sales targets. Particularly effective for B2B and B2C companies targeting the US market in investor pitches and strategic planning documents.
-
Slide Structure
Two-slide layout with each slide containing one US map and three color-emphasized regions paired with three corresponding text boxes. First slide uses black, red, and white; second slide uses black, green, and white to represent different data sets.
Related Products
-

Regional Distribution Chart for Global Marketing Strategy
#Company Introduction #Marketing Plan and Strategy #Other
-

Visualizing Marketing Strategy with Navy Red Map Infographic
#Company Introduction #Marketing Plan and Strategy #Other
-

Infographic Slide Visualizing Exercise Practice Area Location
#Company Introduction #Marketing Plan and Strategy #Other
-

US Target Market Analysis Map
#Market and Competitor Analysis #Marketing Plan and Strategy #Other
