Analysis and Options Text Box – Cluster Diagram
RJ0600068_16
- Last Update 07/08/2025
- File Size 4.7MB
- # of Slides 2
- File Format PPTX
- Slide Ratio 16:9
- Color
Keywords
- #Content-Based Slides
- #Design-Based Slides
- #Operational Plan
- #Technical Approach
- #Diagram
- #Business Support Plan
- #Service Configuration Plan
- #Cluster
- #Closed Cluster Diagram
- #16:9
- #closed cluster diagram PowerPoint
- #analysis solutions slide template
- #3-section text box presentation
- #cluster diagram slide design
- #relationship diagram PowerPoint download
About the Product
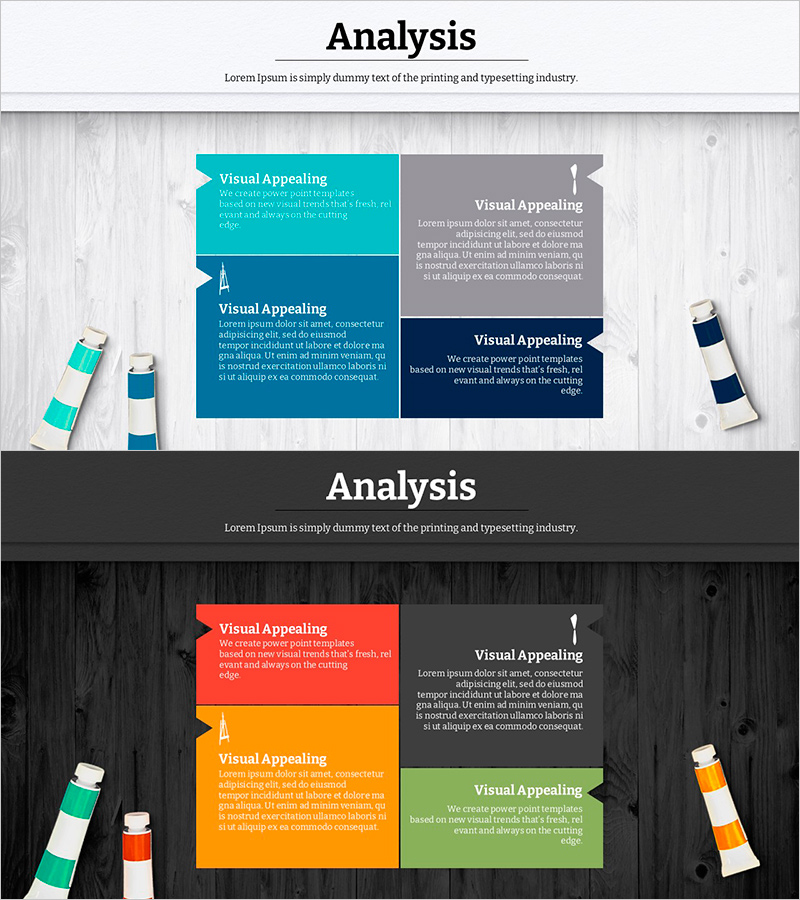
A closed cluster diagram PowerPoint slide for visualizing analysis and solutions across three distinct sections. The design features three color-coded text boxes on the left (teal, deep blue, navy) connected by arrows to a gray explanation area on the right. This 16:9 widescreen template with 2 slides enables clear presentation of complex information through structured visual relationships. Ideal for operational planning, technical reviews, and strategic presentations where logical connections between analysis points and solutions need to be communicated effectively.
Usage Points
-
Main Usage
Visualize analysis findings and corresponding solutions by dividing content into distinct sections, with arrow connections showing logical relationships. Effectively communicates complex information in executive briefings, strategy meetings, and technical reviews where structured analysis presentation is critical.
-
How to Use
Enter analysis items, current status, and issues in the three left text boxes, then add solutions and improvement strategies in the right gray area. Color differentiation emphasizes each section's purpose, while arrows clarify cause-and-effect relationships. The 16:9 format optimizes display on projectors and online presentation platforms.
-
Recommended For
Executives, project managers, technical leads, and consultants presenting operational plans, technical strategies, and business analyses. Valuable for internal meetings, client proposals, and management reports where information structuring and decision-making process explanation are essential.
-
Slide Structure
Two-slide template with the first slide featuring three color-coded text boxes (teal, deep blue, navy) on the left connected to a gray explanation section on the right. The second slide uses an alternative color scheme with identical structure, allowing presentation of multiple analysis scenarios. Arrow connections form a closed relationship diagram structure.
Related Products
-

Effective Solutions for Business Growth – Success and Innovation
#Business Strategy #Operational Plan #Diagram
-

Travel Considerations Slide Template – Innovation and Planning
#Operational Plan #Technical Approach #Diagram
-

Visualizing the Collaborative Process – Cluster Slide
#Business Management #Operational Plan #Diagram
-

Slide for Women's Fashion Item Recommendations – Innovative Service Structuring
#Technical Approach #Diagram #Service Configuration Plan
