Hexagonal Donut Chart – A Revolution in Data Visualization
RJ0600067_17
- Last Update 07/07/2025
- File Size 0.2MB
- # of Slides 2
- File Format PPTX
- Slide Ratio 16:9
- Color
Keywords
About the Product
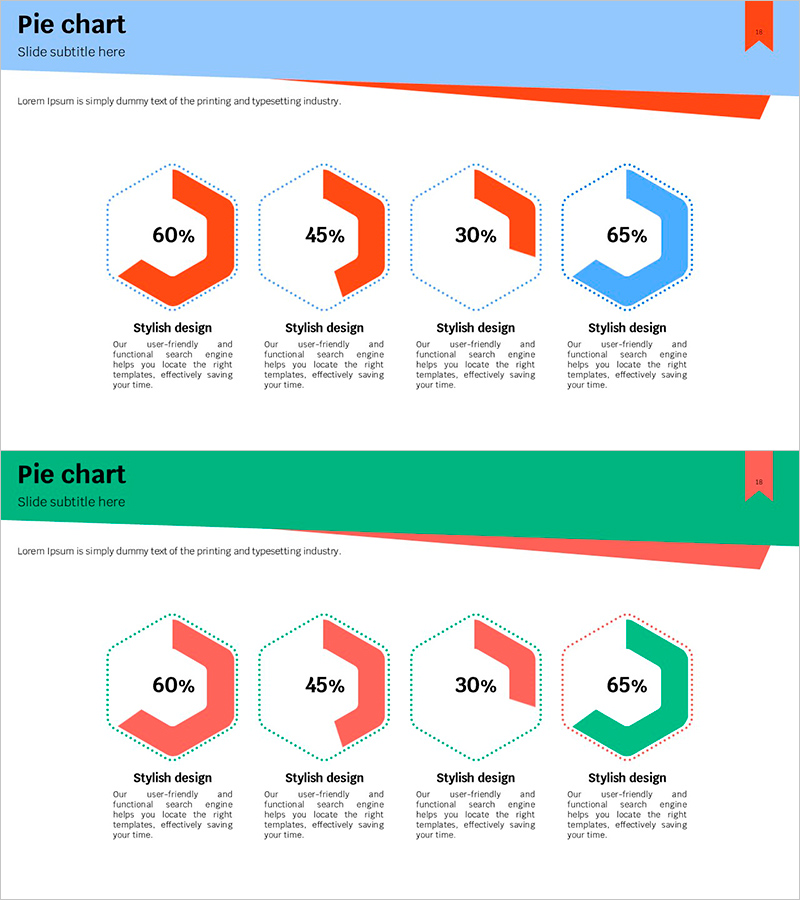
A PowerPoint slide featuring hexagonal donut charts that intuitively display data ratios across four items. The design uses a two-tone color scheme of orange and blue, with each chart positioned within a hexagonal frame to maximize visual impact. Below each chart is a dedicated text area for descriptions, making it ideal for presenting marketing performance, sales composition, customer satisfaction metrics, and other comparative data. The template consists of 2 slides optimized for 16:9 widescreen format and is fully editable in PowerPoint for immediate use in presentations.
Usage Points
-
Main Usage
Emphasizes data ratios by positioning donut charts within hexagonal frames, creating a distinctive visual presentation. Ideal for marketing performance analysis, sales composition breakdown, customer satisfaction surveys, market share distribution, and any comparative data requiring four-item ratio visualization.
-
How to Use
Double-click the chart values and labels to input your own data. Colors can be customized to match your corporate brand guidelines, and text areas below each chart can be filled with item descriptions to enhance presentation context and narrative flow.
-
Recommended For
Marketing teams presenting campaign performance reports, sales teams delivering quarterly results, executive-level business status updates, consulting proposals requiring data analysis sections, and academic presentations visualizing survey results.
-
Slide Structure
2-slide layout with 4 hexagonal donut charts arranged horizontally on each slide. Each chart includes a text area below for descriptions. Slide 1 features three orange and one blue chart; Slide 2 displays orange, pink, blue, and green charts for diverse data representation options.
Related Products
-

Origami Pie Chart Slide – Effective Data Visualization
#Graph
-

Premium Management Presentation Horizontal Bar Graph
#Business Strategy #Graph #Achievements
-

Vertical Bar Graph for Vision Growth – Business Development Strategy
#Company Introduction #Business Strategy #Graph
-

Analysis of Online Learning Data Slide
#Market and Competitor Analysis #Diagram #Graph
