Design Technology Systems and Strategies – Emphasizing Strategies with Data Visualization
RJ0900015_15
- Last Update 08/20/2025
- File Size 0.5MB
- # of Slides 2
- File Format PPTX
- Slide Ratio 16:9
- Color
Keywords
- #Content-Based Slides
- #Design-Based Slides
- #Business Strategy
- #Operational Plan
- #Diagram
- #Production Plan
- #Production and Technology Development Strategy
- #Cluster
- #Spread
- #Chain Diagram
- #Centralized Diagram
- #16:9
- #4-node radial diagram PowerPoint
- #hub-and-spoke diagram slide
- #gear diagram template
- #strategic visualization PPT
- #business process diagram PowerPoint
About the Product
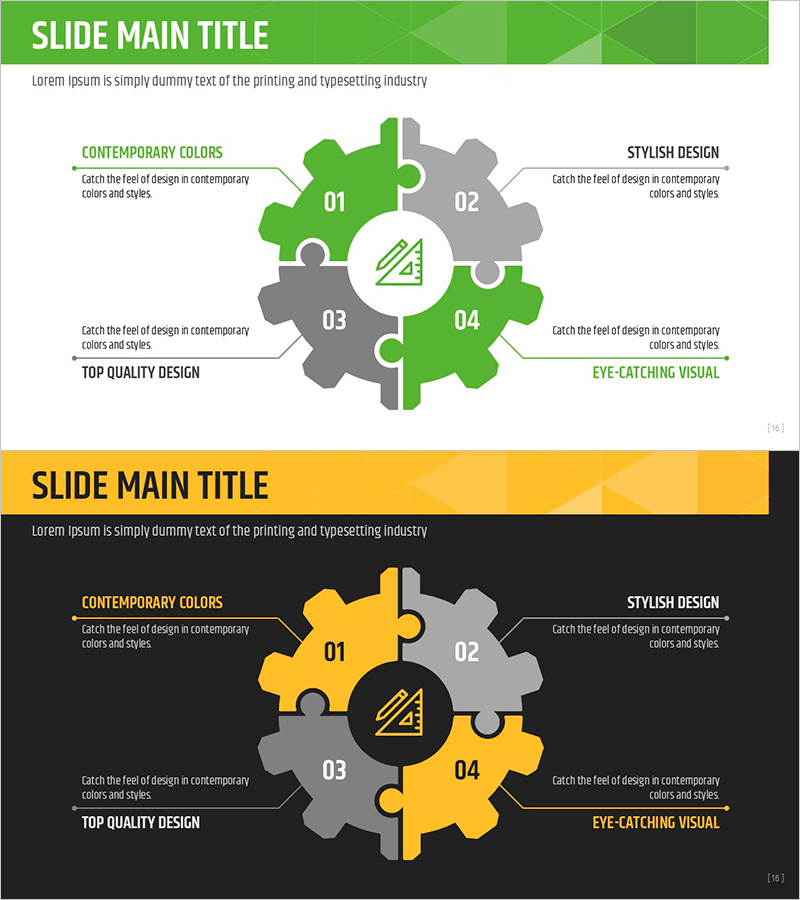
A PowerPoint slide featuring four gear-shaped nodes arranged radially around a central circle, creating a balanced hub-and-spoke composition. The design uses green and gray dual-tone coloring to visually distinguish primary strategies from supporting elements. Each node includes a numbered label and text description area, enabling simultaneous representation of four business dimensions such as strategy, technology, organization, and process. The 2-slide set provides both a light green background version and a dark background version, allowing flexible adaptation to different presentation contexts and document tones. This diagram is particularly effective for analyzing core concepts from multiple perspectives or explaining strategic planning processes in business presentations.
Usage Points
-
Main Usage
Positions four key business elements—strategy, technology, organization, and process—around a central concept to illustrate interconnected relationships and integrated structure at a glance. Ideal for executive reports, strategic planning presentations, and technical architecture explanations.
-
How to Use
Enter your core theme in the central circle and populate the four gear-shaped nodes with corresponding strategic, technical, organizational, and process details. Use the light green background slide for bright, engaging presentations and the dark background slide for formal, professional reports. Enhance each node with custom text and icons to emphasize specific attributes.
-
Recommended For
Executives, strategic planners, technology leaders, and organizational development professionals explaining complex business concepts. Recommended for business plans, technical proposals, organizational restructuring presentations, and integrated marketing strategy documents.
-
Slide Structure
2-slide set. Slide 1: Light green background with four gear-shaped nodes (01–04) arranged radially around a central circle, each with adjacent text description areas. Slide 2: Dark background with identical structure, nodes highlighted in green, gray, and yellow accents. 16:9 widescreen format, PPTX file.
Related Products
-

Types of Agricultural Equipment Machinery – Well-Organized Diagram
#Business Strategy #Diagram #Production Plan
-

Infographic Slide Highlighting the Coffee Bean Development Process
#Business Strategy #Operational Plan #Diagram
-

Diagram Slide Visualizing Food Ingredient Production Strategy
#Business Strategy #Operational Plan #Diagram
-

Question Mark Connection Diagram – Facilitating Business Strategy
#Business Strategy #Operational Plan #Diagram
