Business Flow Diagram – Company History and Direction
RJ0600062_4
- Last Update 07/06/2025
- File Size 2.1MB
- # of Slides 2
- File Format PPTX
- Slide Ratio 16:9
- Color
Keywords
About the Product
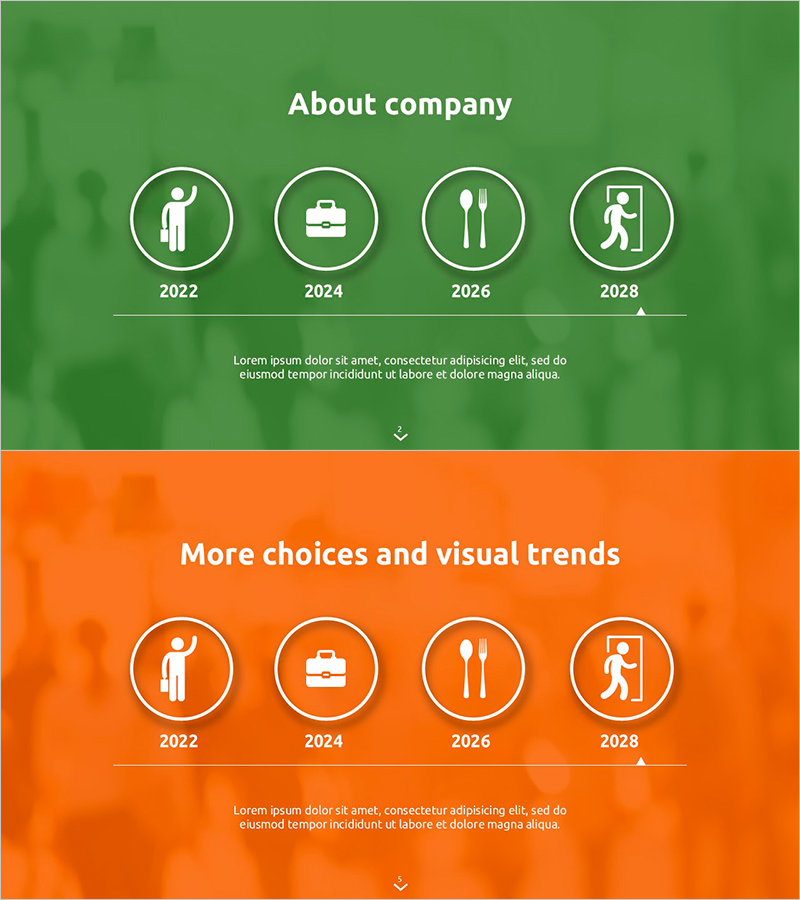
A timeline diagram PowerPoint slide that visualizes your company's history and development direction across four milestone years. This presentation template features two design versions with green and orange backgrounds, each stage marked with icons and year labels to effectively communicate your organization's growth journey. Available in 16:9 widescreen PPTX format for immediate editing, perfect for company overview presentations and business strategy reports. Each node is designed to accommodate custom text, allowing you to input specific business achievements or performance metrics that align with your corporate narrative.
Usage Points
-
Main Usage
Effectively visualize your company's journey from founding to present day by arranging key milestones in chronological order, helping audiences understand your organization's growth trajectory and strategic direction. Icon and year labels at each stage create clear information hierarchy and maximize presentation impact.
-
How to Use
Ideal for company overview presentations in the corporate history section, business strategy reports highlighting achievements and future plans, and investor pitch decks explaining company background. Customize each node's text and icons to reflect your specific business milestones, accomplishments, or strategic initiatives.
-
Recommended For
Corporate executives, marketing professionals, and business planning teams presenting company history and vision. Suitable for new employee orientation, client meetings, investor presentations, press briefings, and other professional business contexts.
-
Slide Structure
Two-slide set featuring identical timeline layouts in contrasting color schemes: green background on slide 1, orange on slide 2. Each slide contains four circular nodes with icons, year labels, and descriptive text areas below, connected by linear progression lines to emphasize chronological flow.
Related Products
-

Clothing Business History Diagram – Innovation and Growth
#Company Introduction #Business Strategy #Diagram
-

Basic History Introduction Slides – Overview of Company History
#Company Introduction #Business Strategy #Diagram
-

Timeline of Animal Music Activities Visualized in a Diagram Slide
#Company Introduction #Business Strategy #Diagram
-

Year-by-year Career Page – Roadmap for Business Growth
#Company Introduction #Business Strategy #Diagram
