Two-Way Diagram – Effective Information Delivery
RJ0600062_15
- Last Update 07/06/2025
- File Size 3.4MB
- # of Slides 2
- File Format PPTX
- Slide Ratio 16:9
- Color
Keywords
About the Product
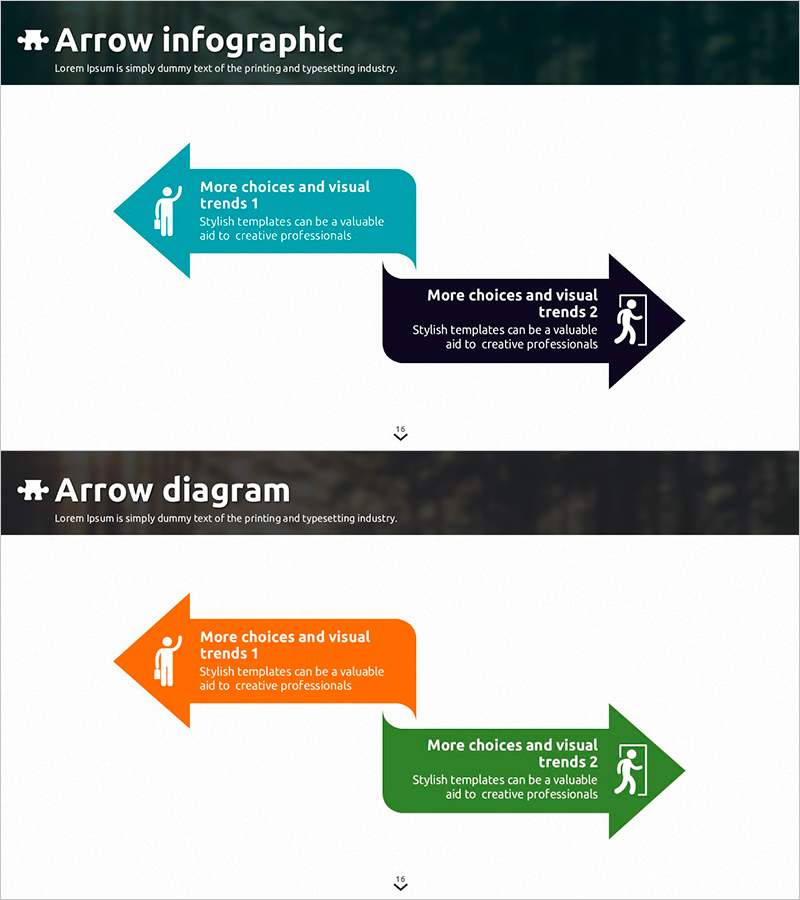
A two-directional arrow diagram PowerPoint slide designed to illustrate bidirectional flow and interaction. Features two color schemes: teal-and-black and orange-and-green combinations. Each arrow includes an icon placeholder and text area for customization. Ideal for presenting mutual relationships, feedback loops, reciprocal processes, and two-way communication in business presentations. Provided in 16:9 widescreen PPTX format, fully editable and ready to use in strategy presentations, project explanations, and organizational communication slides.
Usage Points
-
Main Usage
Visualizes bidirectional flow, mutual interaction, feedback mechanisms, and reciprocal processes. Effectively represents relationships between two equal entities or illustrates cyclical interactions. Applicable to business process flows, inter-departmental collaboration, customer-company relationships, and organizational communication scenarios.
-
How to Use
Enter titles, descriptions, and key content in each arrow section to represent bidirectional relationships. Maintain the provided color scheme or customize with corporate brand colors. Replace icons to denote specific roles, departments, or process stages. Adjust text size and positioning to emphasize key information and improve visual hierarchy.
-
Recommended For
Ideal for strategy, marketing, and operations professionals explaining interaction mechanisms and collaborative processes. Recommended for presentations on organizational relationships, supply chain dynamics, customer journeys, and project phase interactions. Effective in executive briefings, team meetings, and client presentations where complex bidirectional relationships need clear, concise visual communication.
-
Slide Structure
2-slide set. First slide features teal left-pointing arrow and black right-pointing arrow representing bidirectional flow. Second slide presents orange left-pointing arrow and green right-pointing arrow as color variation. Each arrow includes icon placeholder and text input area. Optimized for 16:9 widescreen format with balanced spacing and professional layout.
Related Products
-

Circle Split SWOT Analysis Diagram – New Horizons in Market Analysis
#Market and Competitor Analysis #Diagram #SWOT Analysis
-

Curved Theme Purple Template Diagram – Essential Tool for Business Strategy
#Product/Service Introduction #Business Strategy #Diagram
-

Hexagonal Nested Core Diagram – Emphasizing Business Strategy and Features
#Product/Service Introduction #Business Vision and Strategy #Diagram
-

Vision and Goals Introduction Diagram – Objective Setting and Vision Sharing
#Company Introduction #Business Vision and Strategy #Diagram
