Priority Rounding Diagram - Core of Business
RJ0600056_7
- Last Update 07/05/2025
- File Size 2.6MB
- # of Slides 2
- File Format PPTX
- Slide Ratio 16:9
- Color
Keywords
About the Product
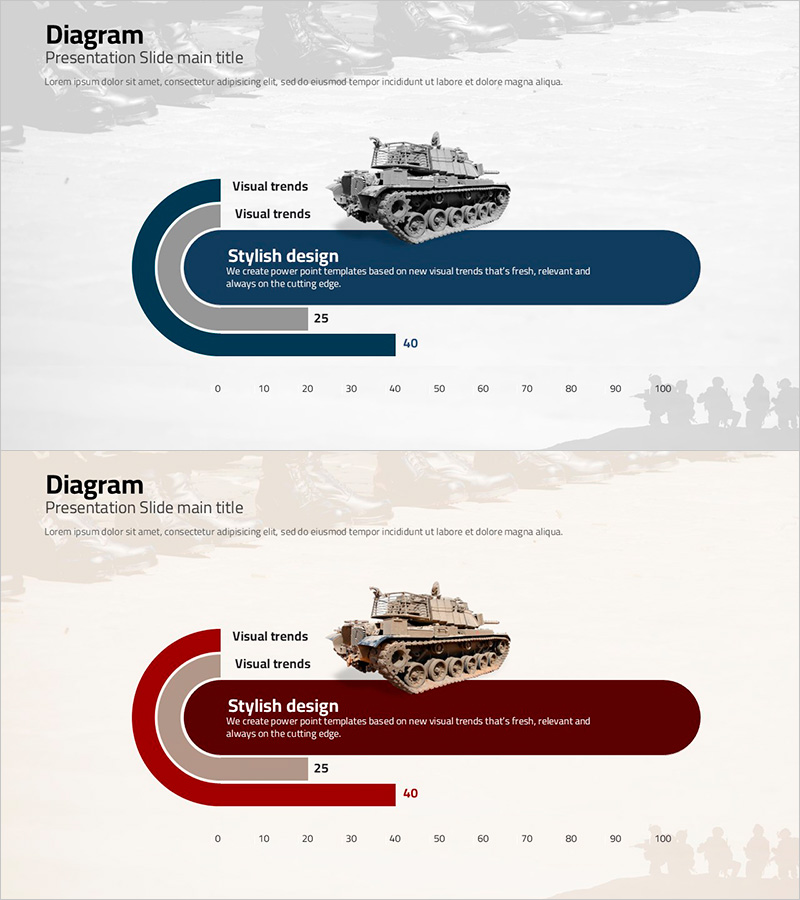
A concentric rounding diagram PowerPoint slide that visualizes core business priorities and decision-making processes. The navy and gray tonal layers create a clear hierarchy of importance, with text boxes and numerical data positioned for comparative analysis. This 2-slide set is optimized for immediate use in various presentation scenarios, delivered in PPTX format with 16:9 widescreen aspect ratio. Perfect for executive briefings, strategic planning sessions, and project prioritization discussions where you need to communicate decision-making frameworks and resource allocation priorities effectively.
Usage Points
-
Main Usage
Communicate priority hierarchies and decision-making frameworks in executive meetings, strategic planning sessions, and project management discussions. The concentric rounding structure with navy and gray tones creates visual clarity for importance ranking, while integrated text boxes and numerical data support comparative analysis and resource allocation decisions.
-
How to Use
Open the slides and replace the text labels in each rounding layer with your priority items. Update the numerical values (25, 40, etc.) to reflect actual percentages, scores, or metrics relevant to your analysis. Adjust colors as needed to match your corporate branding. Both slides share the same structure, allowing you to reuse them for multiple priority-setting topics.
-
Recommended For
Executive and C-suite presentations, strategic planning team priority analysis, project manager resource allocation explanations, marketing team campaign prioritization pitches, organizational restructuring priority communication, and business development priority setting discussions.
-
Slide Structure
Both slides feature identical layouts with a central text box surrounded by 3 concentric rounding layers (navy, gray, light gray) representing priority tiers. Each layer includes labels and numerical data fields. A tank image positioned on the right side provides visual emphasis and thematic reinforcement.
Related Products
-

Market Trend Analysis Diagram – Effective Material for Strategy Development
#Market and Competitor Analysis #Diagram #Graph
-

Business Standard Table – Clear Visualization of Financial Performance
#Financial Plans and Performance #Diagram #Sales and Revenue
-

Hexagonal Organizational Chart Diagram – Visualizing Company Structure
#Company Introduction #Technical Approach #Diagram
-

IT Industry Infrastructure Connection Diagram – Business Area Overview
#Business Introduction #Diagram #Business Areas
