Modern Business Plan Presentation Template Text Diagram – Financial Performance and Budget Management
RJ0200015_9
- Last Update 04/01/2025
- File Size 5.1MB
- # of Slides 2
- File Format PPTX
- Slide Ratio 16:9
- Color
Keywords
About the Product
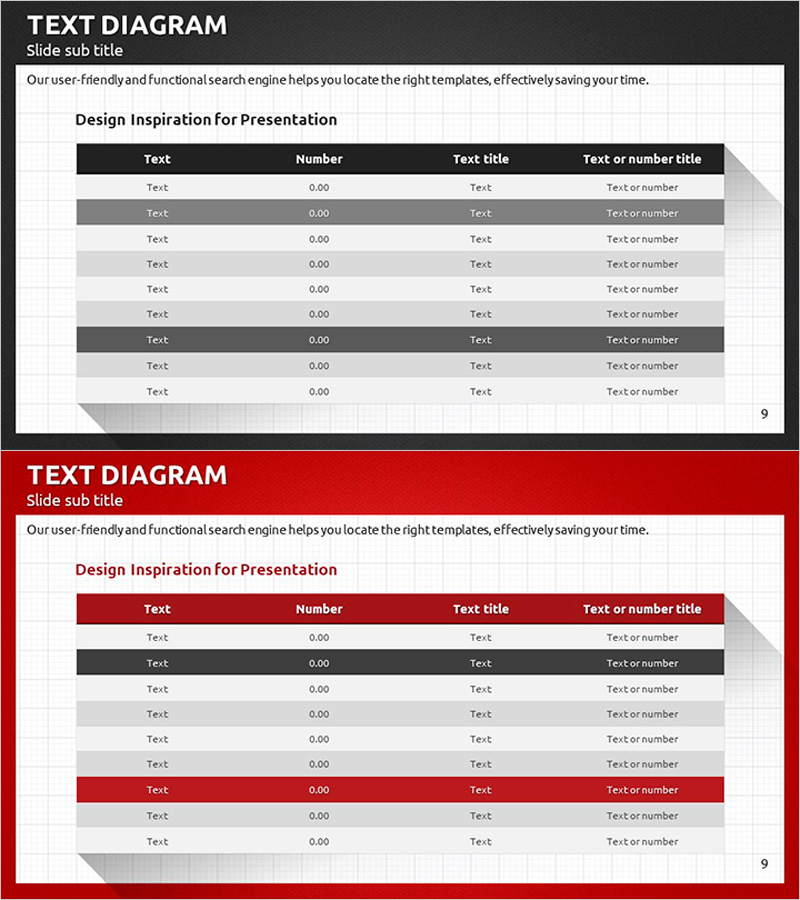
A structured 9-row table-format PowerPoint slide designed for presenting financial data and budget information in business plan presentations. Two color versions are included with black and red header rows for emphasis, featuring a 4-column layout (Text, Number, Text title, Text or number title) that clearly organizes financial performance metrics and budget items for comparison. Grid background and alternating row shading enhance data readability. This 2-slide set in 16:9 widescreen format is ready to edit and use immediately for financial reporting and budget analysis.
Usage Points
-
Main Usage
Present quantitative financial data, budget items, quarterly results, and cost breakdowns in table format during business plan presentations. The 9-row input area accommodates sufficient data volume while maintaining slide readability and professional appearance.
-
How to Use
Use the black header version for formal and conservative financial reports, and the red header version for slides requiring emphasis and attention on key performance indicators. Enter item names, numbers, titles, and descriptions in each row's text fields, and adjust colors as needed for your presentation context.
-
Recommended For
Ideal for CFOs, finance managers, and executives presenting quarterly results, budget reviews, and investor reports. Also suitable for marketing performance metrics, sales results, operational cost analysis, and any business presentation requiring organized data comparison and financial information display.
-
Slide Structure
Table structure with 4 columns (Text, Number, Text title, Text or number title) and 9 data rows. Header row is emphasized in black or red, while data rows alternate between white, gray, and shaded backgrounds for clear row distinction. Page number indicator in bottom right corner.
Related Products
-

Agricultural Budget Table – Harmony of Green and Purple
#Financial Plans and Performance #Diagram #Budget
-

Table of Major Financial Indicators – Optimized for Performance Analysis
#Financial Plans and Performance #Diagram #Budget
-

Financial Indicator Text Table – Financial Performance Analysis
#Financial Plans and Performance #Diagram #Budget
-

Eco-friendly Business Project Main Financial Indicators and Budget Table
#Financial Plans and Performance #Diagram #Budget
