Global Map Eco-Friendly Market Share Analysis by Continent
RJ0600051_11
- Last Update 07/04/2025
- File Size 5.6MB
- # of Slides 2
- File Format PPTX
- Slide Ratio 16:9
- Color
Keywords
About the Product
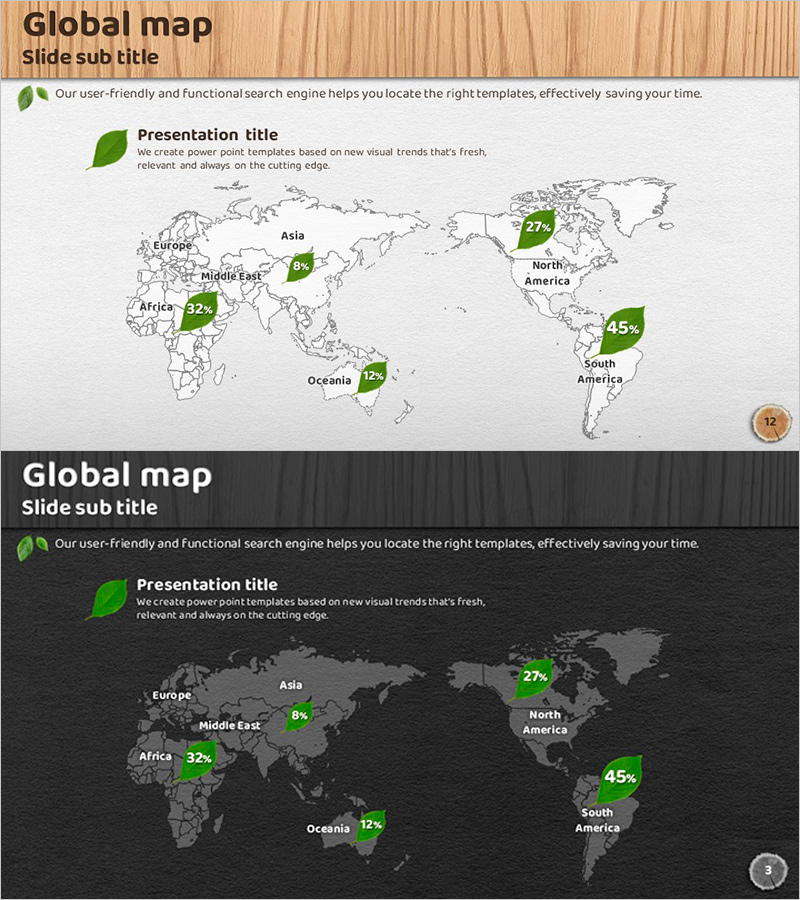
A PowerPoint slide that visualizes market share by continent against a world map background, enabling instant comparison of regional performance metrics. Two versions are provided: a light wood-tone background and a dark background, each featuring green leaf-shaped badges with percentage figures positioned on continents to intuitively represent eco-friendly market data. The slide includes text input areas and is structured to emphasize regional performance indicators, making it immediately applicable for competitive analysis and market overview presentations. Delivered in 16:9 widescreen PPTX format.
Usage Points
-
Main Usage
Optimized for analyzing global market conditions by region and presenting comparative market share data across continents. Ideal for highlighting regional performance metrics of eco-friendly products or services, and for supporting international market expansion strategy development with data-driven evidence.
-
How to Use
Enter your company name, product name, and analysis topic in the slide's text areas, then replace each continent's percentage figures with actual data. The light-tone version emphasizes positive growth imagery, while the dark-tone version reinforces professionalism and credibility.
-
Recommended For
Recommended for marketing strategy documents, market analysis reports, investor pitch decks, and executive briefing presentations when presenting global market overview sections. Particularly effective for multinational corporations, import-export businesses, and global brand managers communicating international market data visually.
-
Slide Structure
The slide comprises title and subtitle input areas alongside world map visualization. Six continents (Europe, Asia, Middle East, Africa, Oceania, North America, South America) each feature percentage badges, with supplementary text space at the bottom for detailed analysis commentary.
Related Products
-

World Map Distribution Chart – Global Market Analysis Tool
#Company Introduction #Market and Competitor Analysis #Other
-

Annual Crime Rate by Country Visualization PowerPoint Template
#Company Introduction #Market and Competitor Analysis #Other
-

Target Regional Analysis Slide – Market Analysis and Strategy
#Market and Competitor Analysis #Marketing Plan and Strategy #Other
-

Brown Background Global Market Analysis – Utilizing Cluster Diagrams
#Market and Competitor Analysis #Diagram #Other
