Energy Saving Innovation Technology and Future Planning Diagram
RJ0600050_18
- Last Update 07/04/2025
- File Size 0.3MB
- # of Slides 2
- File Format PPTX
- Slide Ratio 16:9
- Color
Keywords
- #Content-Based Slides
- #Design-Based Slides
- #Operational Plan
- #Technical Approach
- #Diagram
- #Business Support Plan
- #Innovative Technologies and Future Plans
- #Cluster
- #Closed Cluster Diagram
- #16:9
- #closed diagram PowerPoint
- #4-node circular structure slide
- #energy technology diagram
- #innovation technology PowerPoint
- #diagram slide template
About the Product
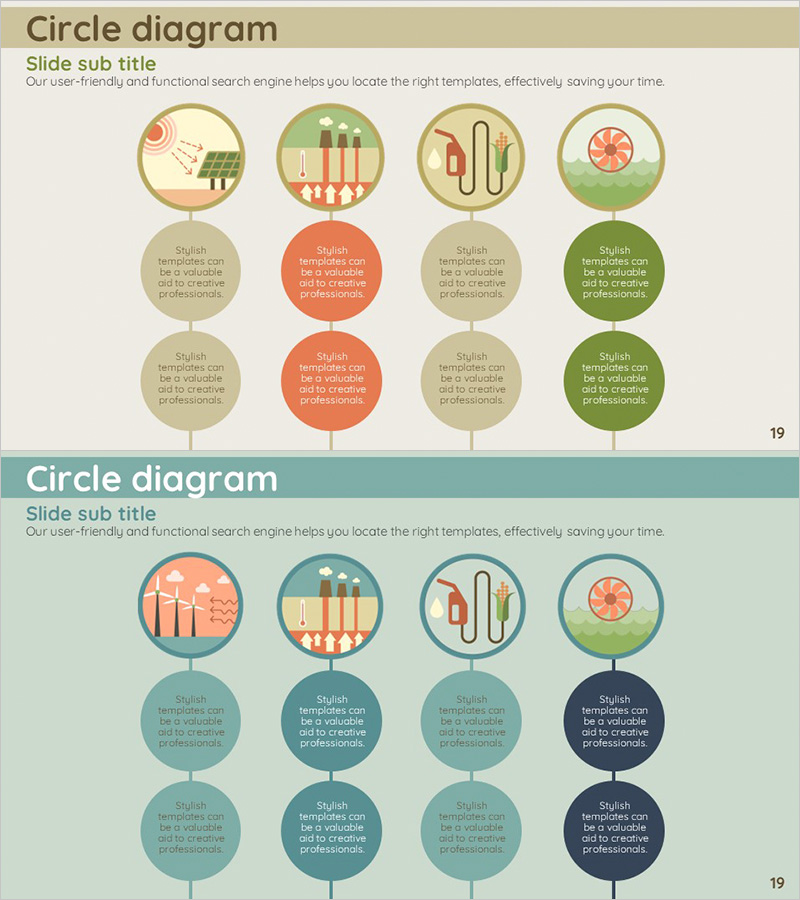
A PowerPoint slide template featuring a 4-node closed-form diagram to visualize energy saving, innovation technology, and future planning. Each node combines a circular icon at the top with two-tier text boxes below, creating a hierarchical information structure. The warm color palette—beige, orange, and green tones—conveys positive innovation messaging. Designed in 16:9 widescreen format across 2 slides, this template is ready for technology sector presentations, sustainability reports, and innovation strategy decks.
Usage Points
-
Main Usage
Visualizes four key elements—energy saving, innovation technology, future planning, and related concepts—in a closed circular structure to emphasize interconnection and integration. Effectively communicates innovation strategy completeness and systematic approach to technology executives, investors, and government stakeholders.
-
How to Use
Insert technology or energy-related images and icons into the circular icon area at the top of each node. Add detailed descriptions and metrics to the two-tier text boxes below. Maintain the color scheme or customize with corporate brand colors. Apply to technology presentations, sustainability reports, and innovation strategy decks.
-
Recommended For
Energy and environmental technology company executives, R&D teams, sustainability officers, investor relations professionals, government policy makers, and academic researchers presenting technology innovation, energy efficiency strategies, and future roadmaps.
-
Slide Structure
2-slide set. Each slide displays 4 identical closed-form nodes arranged horizontally, with circular icons on top and two-tier text boxes below. Vertical connector lines between nodes indicate hierarchical relationships. Slide 1 uses beige, orange, beige, and green tones; Slide 2 features teal, teal, teal, and dark blue variations.
Related Products
-

Visualizing Flower Care Methods – Innovative Diagrams
#Operational Plan #Technical Approach #Diagram
-

Visualizing Operational Plans through Notepad and Tweezers Diagram
#Operational Plan #Technical Approach #Diagram
-

Travel Considerations Slide Template – Innovation and Planning
#Operational Plan #Technical Approach #Diagram
-

Closed Item Rounding Box – Operational Planning and Business Support
#Business Management #Operational Plan #Diagram
