Strategic Approach through Characteristics by Transportation
RJ0800023_24
- Last Update 08/05/2025
- File Size 0.4MB
- # of Slides 2
- File Format PPTX
- Slide Ratio 16:9
- Color
Keywords
- #Content-Based Slides
- #Design-Based Slides
- #Operational Plan
- #Marketing Plan and Strategy
- #Diagram
- #Business Support Plan
- #Distribution Strategy
- #Cluster
- #Closed Cluster Diagram
- #16:9
- #transportation cluster diagram PowerPoint
- #vehicle comparison slide template
- #how to create transportation diagram in PowerPoint
- #operational planning presentation slide
- #marketing strategy diagram download
About the Product
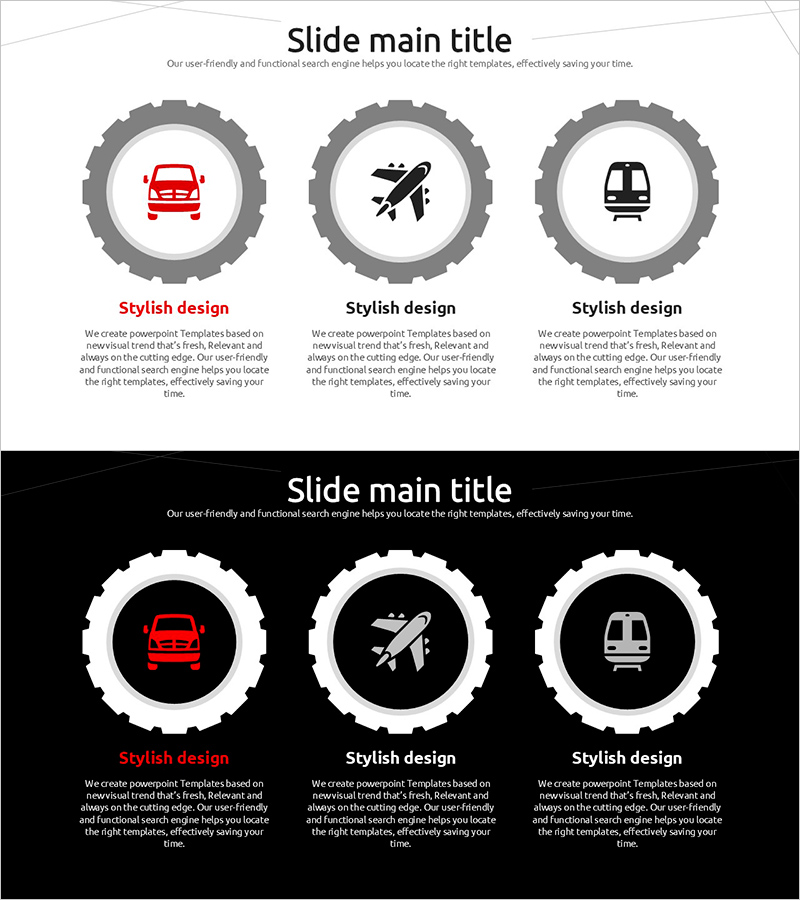
A cluster diagram PowerPoint slide that visually compares characteristics of three transportation modes: automobile, airplane, and train. Each vehicle is represented as a gear-shaped circular node with an icon, making it easy to distinguish and analyze the unique features of each transportation method. Two design versions are provided—one with a light gray background and one with a dark background—allowing you to choose the best fit for your presentation environment. This PowerPoint slide is ideal for operational planning, marketing strategy presentations, and business development discussions where transportation logistics need to be clearly communicated.
Usage Points
-
Main Usage
This slide enables you to compare transportation modes side-by-side and explain the strengths and weaknesses of each vehicle type visually. It supports strategic decision-making by clearly distinguishing operational characteristics, cost structures, and market positioning of automobiles, airplanes, and trains.
-
How to Use
Use this slide when presenting operational planning strategies to explain transportation mode selection criteria, or during marketing presentations to analyze target customer transportation usage patterns. Edit the text within each node to input specific attributes such as cost, speed, capacity, environmental impact, and service coverage.
-
Recommended For
Logistics and transportation industry professionals, business planning teams, marketing managers, strategy consultants, and educators who need to systematically present transportation-related information. Particularly effective for presentations that require balanced comparison of multiple options.
-
Slide Structure
Two-slide layout. Slide 1 features a light gray background with 3 gear-shaped circular nodes (each with transportation icons), and Slide 2 displays the same 3 nodes in white on a black background. Text input areas provided below each node. 16:9 widescreen format in PPTX.
Related Products
-

Table of Contents for Strategic Planning from Takeoff to Arrival – Effective Operational Planning
#Operational Plan #Marketing Plan and Strategy #Diagram
-

Sea Lighthouse Social Contribution Activity Page - Community Engagement
#Operational Plan #Risk Management and Regulatory Compliance #Diagram
-

Analysis and Options Text Box – Cluster Diagram
#Operational Plan #Technical Approach #Diagram
-

Effective Solutions for Business Growth – Success and Innovation
#Business Strategy #Operational Plan #Diagram
