Energy Saving Business Financial Indicator Table
RJ0600050_12
- Last Update 07/04/2025
- File Size 0.4MB
- # of Slides 2
- File Format PPTX
- Slide Ratio 16:9
- Color
Keywords
About the Product
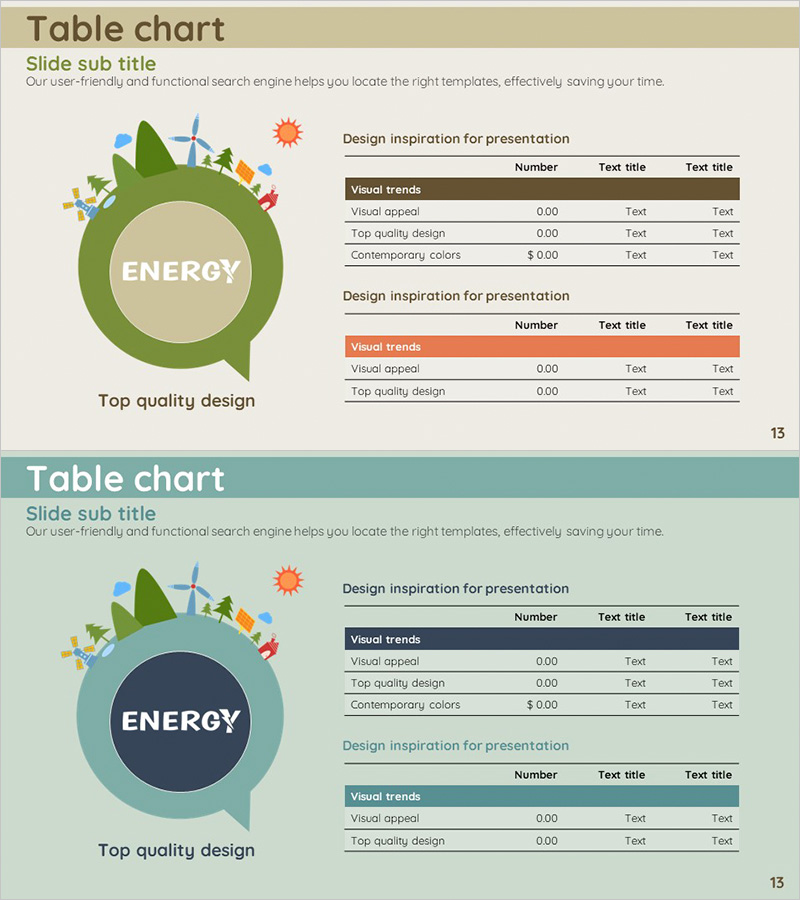
A table-based PowerPoint slide designed to present financial performance metrics for energy-saving business initiatives. This 2-slide set features two color themes: beige and teal, each with a 3-column (Item, Number, Description) and 4-row data entry structure. The header row is highlighted to emphasize key financial indicators such as visual appeal, design quality, and current status. Ideal for financial reports, business proposals, and executive presentations where clear data comparison and decision-making support are essential. Ready to edit and deploy in PowerPoint presentations, reports, and planning documents.
Usage Points
-
Main Usage
Organize financial performance, budget status, and key metrics in table format for decision-making support. Deliver credible, data-driven presentations in business reports, investor briefings, and executive updates.
-
How to Use
Input actual financial figures, item names, and descriptions into each table cell. Maintain header row colors (brown and teal) while editing data rows. Adjust font size and cell dimensions to accommodate additional items if needed.
-
Recommended For
CFOs, finance managers, business planning teams, and executive presenters. Ideal for energy, environmental, and sustainability business proposals, annual reports, and investor pitch decks.
-
Slide Structure
Slide 1 (Beige theme): Brown-highlighted header row with 3-column × 4-row data input area. Slide 2 (Teal theme): Teal-highlighted header row with identical 3-column × 4-row structure. Left-side energy icon illustration reinforces the topic visually.
Related Products
-

Table of Major Financial Indicators – Optimized for Performance Analysis
#Financial Plans and Performance #Diagram #Budget
-

Diet Meal Table – Healthy Financial Planning
#Financial Plans and Performance #Diagram #Budget
-

Red Purple Highlight Table – An Ideal Choice for Financial Planning
#Financial Plans and Performance #Diagram #Budget
-

Travel Table Text Box – Visualizing Financial Plans and Outcomes
#Financial Plans and Performance #Diagram #Budget
