Renewable Energy Risk Management Circulation Diagram Green Mint
RJ0600048_15
- Last Update 07/03/2025
- File Size 1.8MB
- # of Slides 2
- File Format PPTX
- Slide Ratio 16:9
- Color
Keywords
About the Product
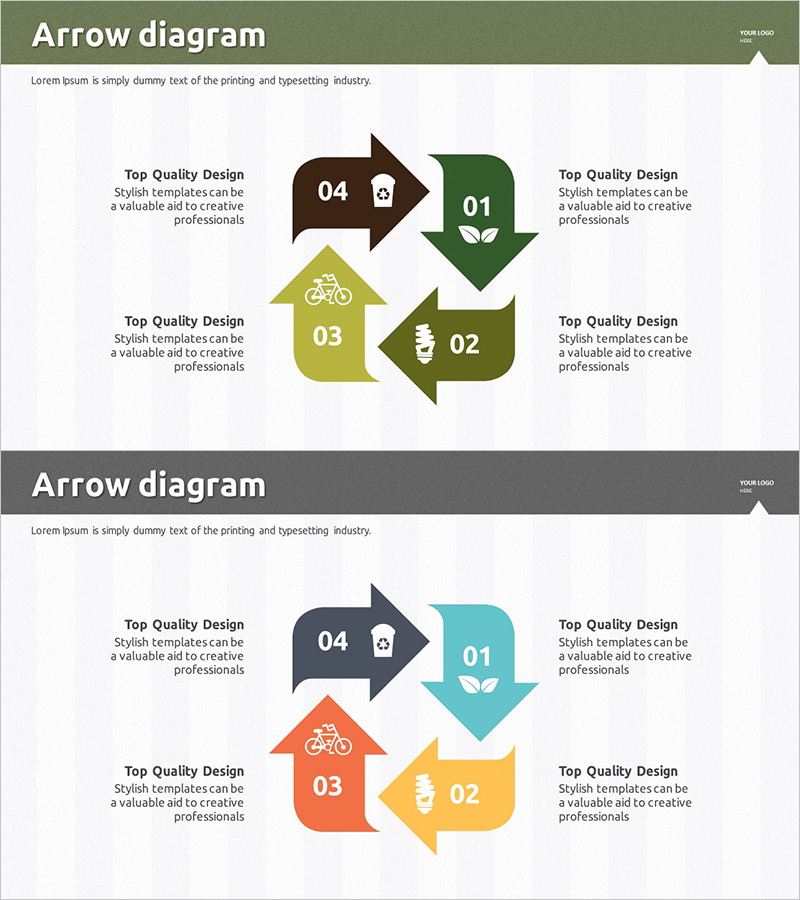
A PowerPoint slide featuring a 4-step circular diagram ideal for presenting renewable energy and risk management processes. The design uses arrow-shaped elements radiating from a central point in four directions, with numbered nodes, icons, and text areas for each stage. The warm color palette of green, mint, and brown tones emphasizes environmental themes while maintaining professional clarity. This circular flow diagram is perfect for presentations, business proposals, and strategic planning documents that require visual representation of cyclical processes, continuous improvement cycles, or iterative workflows. Two color variations are included to match your document's branding.
Usage Points
-
Main Usage
Clearly communicate cyclical processes, continuous workflows, and iterative systems in renewable energy, environmental policy, and risk management contexts. The radial arrow structure from a central point effectively demonstrates both the independence of each stage and their interconnected nature within a complete cycle.
-
How to Use
Enter stage names, descriptions, and metrics into each arrow section to complete the circular flow. Integrate into presentation slides covering strategy, operations, or process management sections. Use the two color variations to align with your corporate branding or document theme. Drag-and-drop editing allows quick customization without design skills.
-
Recommended For
Environmental and energy sector professionals, policy makers, sustainability report authors, project managers, and consultants explaining operational cycles. Recommended for business plans, marketing proposals, pitch decks, and training materials where cyclical or continuous processes need visual emphasis.
-
Slide Structure
Central hub with four directional arrows (up, down, left, right) forming a circular layout. Each arrow contains a numbered node (01-04), icon, and text box. External text areas provide space for detailed descriptions. Two color schemes available: green-mint-brown and alternative warm tones.
Related Products
-

Business Forest Wide Template Diagram11 – Circular Process Representation
#Business Strategy #Operational Plan #Diagram
-

Airplane Circulation Diagram – Efficient Operation Planning
#Operational Plan #Technical Approach #Diagram
-

Sailing Travel Business Vision Diagram – Capturing Future Vision
#Operational Plan #Technical Approach #Diagram
-

Diagram Using Coffee Beans for Visualizing Operations Strategy – Efficient Production Management
#Operational Plan #Diagram #Production and Technology Development Strategy
