Global Warming Analysis Graph
RL0100016_4
- Last Update 01/19/2025
- File Size 1.5MB
- # of Slides 2
- File Format PPTX
- Slide Ratio 4:3
- Color
Keywords
About the Product
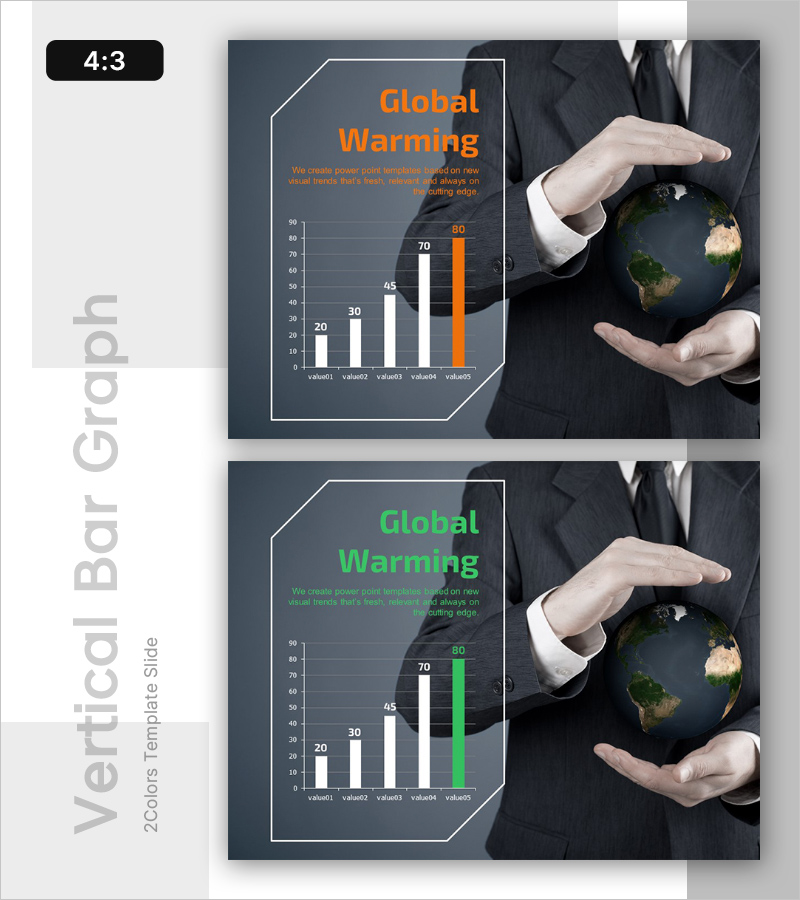
A 2-slide vertical bar chart PowerPoint presentation visualizing global warming trends with data values (20, 30, 45, 70, 80) highlighted in orange and white against a dark gray background. The left side features a title and descriptive text area, while the right side displays a businessman holding a globe, emphasizing the urgency of environmental issues. In 4:3 ratio PPTX format, this slide deck is ready for immediate use in climate change, environmental analysis, and sustainability presentations.
Usage Points
-
Main Usage
Visualizes data-driven analysis of climate change and environmental issues to enhance audience comprehension and persuasiveness. Quantitatively represents global warming trends and emphasizes the severity of environmental challenges.
-
How to Use
Use in ESG reports, environmental policy presentations, climate change conferences, and sustainability seminars as a data-backed argument slide. Customize by entering specific figures and analysis content in the text areas to match your presentation context.
-
Recommended For
Environmental policy officers, ESG strategy teams, climate change researchers, sustainability consultants, environmental NGO activists, and academic instructors presenting on environmental and climate issues.
-
Slide Structure
Two-slide layout with left text area (one title, one descriptive text) and right side featuring a vertical bar graph with five data points plus image space. Dark background with orange and white accents maximizes data readability, while business imagery visually conveys environmental responsibility.
Related Products
-

AI Innovation Business Ideas Slide – Creative Visualization
#Emotional Messages
-

Business Idea Analysis Graph – Innovation and Vision
#Emotional Messages
-

Corporate Future Outlook Analysis Graph – Visualizing Future Predictions
#Emotional Messages
-

Future-oriented Template Cover – Bright Vision Ahead
#Emotional Messages
