Business Idea Analysis Graph – Innovation and Vision
RL0100021_3
- Last Update 01/19/2025
- File Size 2.2MB
- # of Slides 2
- File Format PPTX
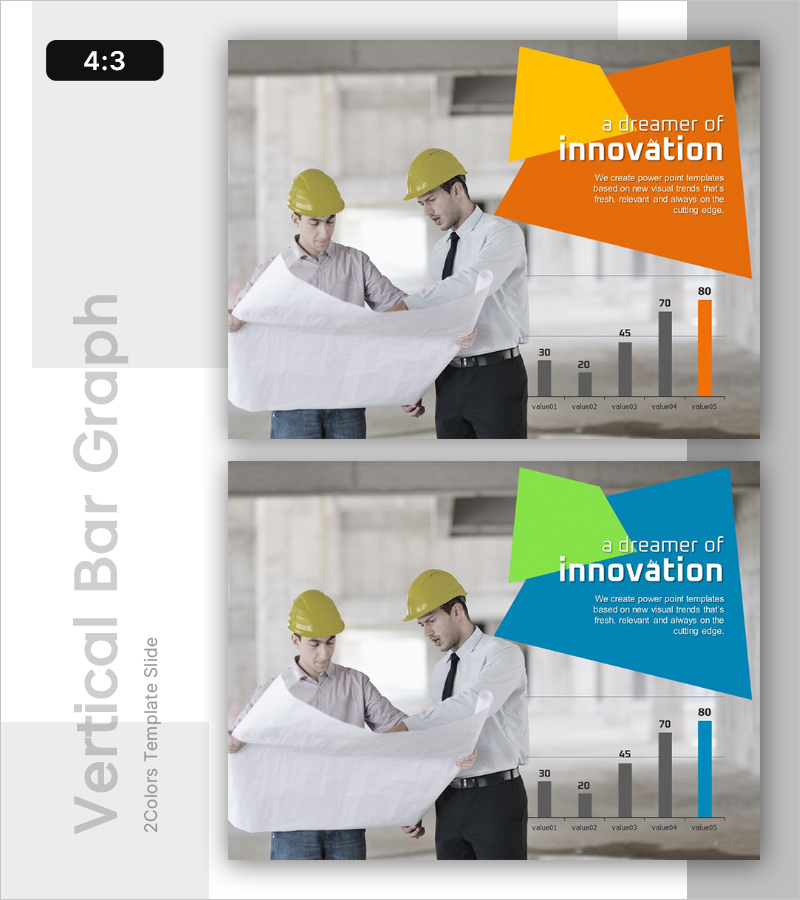
- Slide Ratio 4:3
- Color
Keywords
About the Product
This slide features horizontal and vertical bar charts designed for analyzing business ideas, helping to visualize data for better decision-making. It presents a clear structure for comparing and analyzing data, making it ideal for discussing market trends and competitive analysis. The combination of orange and blue colors evokes a sense of innovation, adding impactful sentiment to your presentation. Perfect for executive reports and investment proposals, this template allows for easy editing of text and graph elements, enhancing user convenience.
Usage Points
-
Main Usage
- This template is essential for presenting business ideas in meetings where data-driven decisions are required, effectively enabling stakeholders to grasp complex information quickly.
-
How to Use
- Utilize this template during executive briefings to illustrate data insights, making it easier for participants to understand key metrics and support their decision-making processes.
-
Recommended For
- Ideal for business analysts and executives who need to prepare reports or proposals that require a visual representation of data for client meetings or strategic planning sessions.
-
Slide Structure
- The arrangement includes a logical flow of bar charts that guide the audience through various aspects of market analysis, ensuring clarity when discussing trends and comparisons.
Related Products
-

Opportunities for Advancement in Life – Vision and Strategy for Success
#Emotional Messages
-

Future-oriented Template Cover – Bright Vision Ahead
#Emotional Messages
-

Cluster Slide for Company Overview - See the Possibilities
#Emotional Messages
-

Corporate Future Outlook Analysis Graph – Visualizing Future Predictions
#Emotional Messages
