Navy-Orange Map Slide – Company Introduction and Resource Allocation
RJ0600045_11
- Last Update 07/02/2025
- File Size 0.5MB
- # of Slides 2
- File Format PPTX
- Slide Ratio 16:9
- Color
Keywords
About the Product
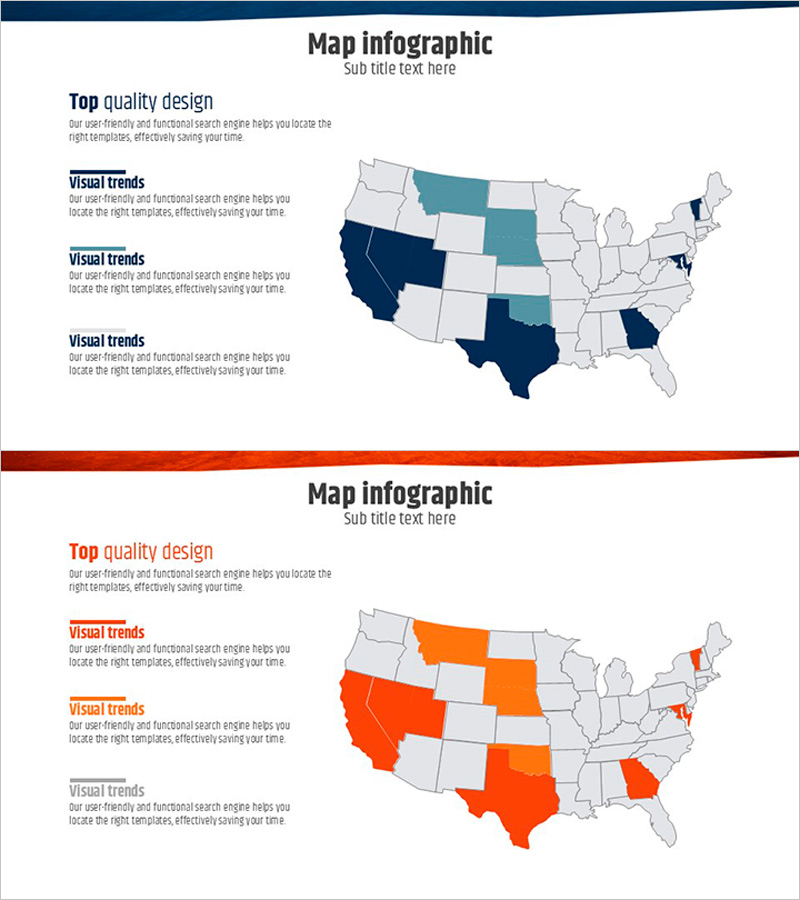
A 2-slide PowerPoint presentation featuring a US map-based regional data visualization design. The layout combines navy and orange color schemes, with each state rendered in varying tones to enable comparative analysis at a glance. The left side includes three text input areas for key insights and market trends, while the right side map displays regional performance, market share, and business metrics. Immediately applicable for company introductions, market analysis, and business performance presentations.
Usage Points
-
Main Usage
Visualize regional market conditions, market share, and performance metrics using color-coded map regions to present data-driven business decisions. Effectively communicate regional strategies in company introductions, market analysis, and business expansion planning presentations.
-
How to Use
Enter regional characteristics, market trends, and performance indicators in the three left-side text areas. Modify map colors to match data categories (high/medium/low or target/current/gap) for comparative analysis and reporting.
-
Recommended For
Marketing professionals, sales strategy teams, executives preparing business reports, companies planning regional expansion, organizations conducting market research and competitive analysis presentations.
-
Slide Structure
2-slide deck: Navy-tone slide (3 text boxes + map) and orange-tone slide (3 text boxes + map). Each slide features a two-column layout with left explanation area and right map area, using regional color differentiation to represent data hierarchy.
Related Products
-

Target Area Analysis - Effective Data Visualization
#Company Introduction #Other #Domestic Network
-

Analyzing the Map of America – Key Values and Market Status
#Company Introduction #Other #Domestic Network
-

Map of Domestic Networks and Partners in the U.S. – Orange, Green, Purple
#Company Introduction #Other #Customers and Partners
-

Graph of Analysis by Year in the Americas – Infrastructure and Business Strategy
#Company Introduction #Business Introduction #Graph
