Target Area Analysis - Effective Data Visualization
RJ0600039_11
- Last Update 07/01/2025
- File Size 2.8MB
- # of Slides 2
- File Format PPTX
- Slide Ratio 16:9
- Color
Keywords
About the Product
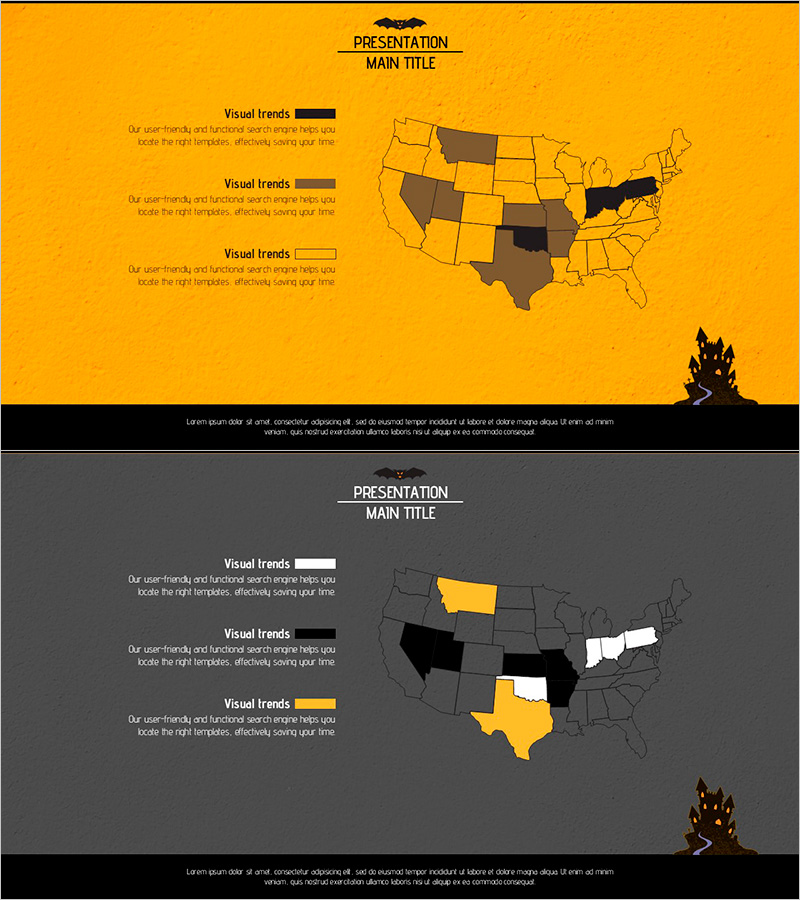
A US map-based regional data visualization PowerPoint slide featuring a golden background with brown, black, and white state-level regional analysis layout. Ideal for comparing market entry regions, sales offices, and customer distribution at a glance. The left side contains three text areas for describing regional characteristics, while the right side highlights corresponding regions on the map. Designed for immediate use in company overview, market analysis, and sales strategy presentations. This 2-slide set comes in 16:9 PPTX format with fully editable elements.
Usage Points
-
Main Usage
Visualize regional market conditions, sales offices, and customer distribution using map-based layout to support decision-making. Simultaneously convey regional characteristics through text and map highlighting to enhance audience comprehension.
-
How to Use
Enter specific data such as region name, sales figures, and customer count in the three left text boxes. Highlight corresponding states on the right map using color coding. Use in market overview sections of company presentations or regional analysis pages in sales strategy reports.
-
Recommended For
Regional market analysis presentations by marketing, sales, and strategy departments; market entry plan sections in investor-focused IR materials; regional business model explanation documents.
-
Slide Structure
2-slide set with golden background. Each slide features three text input areas on the left (with Visual trends labels) and a US map on the right with three-level highlighting in brown, black, and white.
Related Products
-

Market Analysis with Map Infographic Illustration – Strategies for Business Success
#Company Introduction #Market and Competitor Analysis #Other
-

Aurora Analysis by US Region – Visualization for Insights
#Company Introduction #Market and Competitor Analysis #Other
-

Map of Domestic Networks and Partners in the U.S. – Orange, Green, Purple
#Company Introduction #Other #Customers and Partners
-

South Korea Target Area Infrastructure Map – Market and Competitor Analysis
#Company Introduction #Market and Competitor Analysis #Other
